
Skip to content
Sign inGet started free
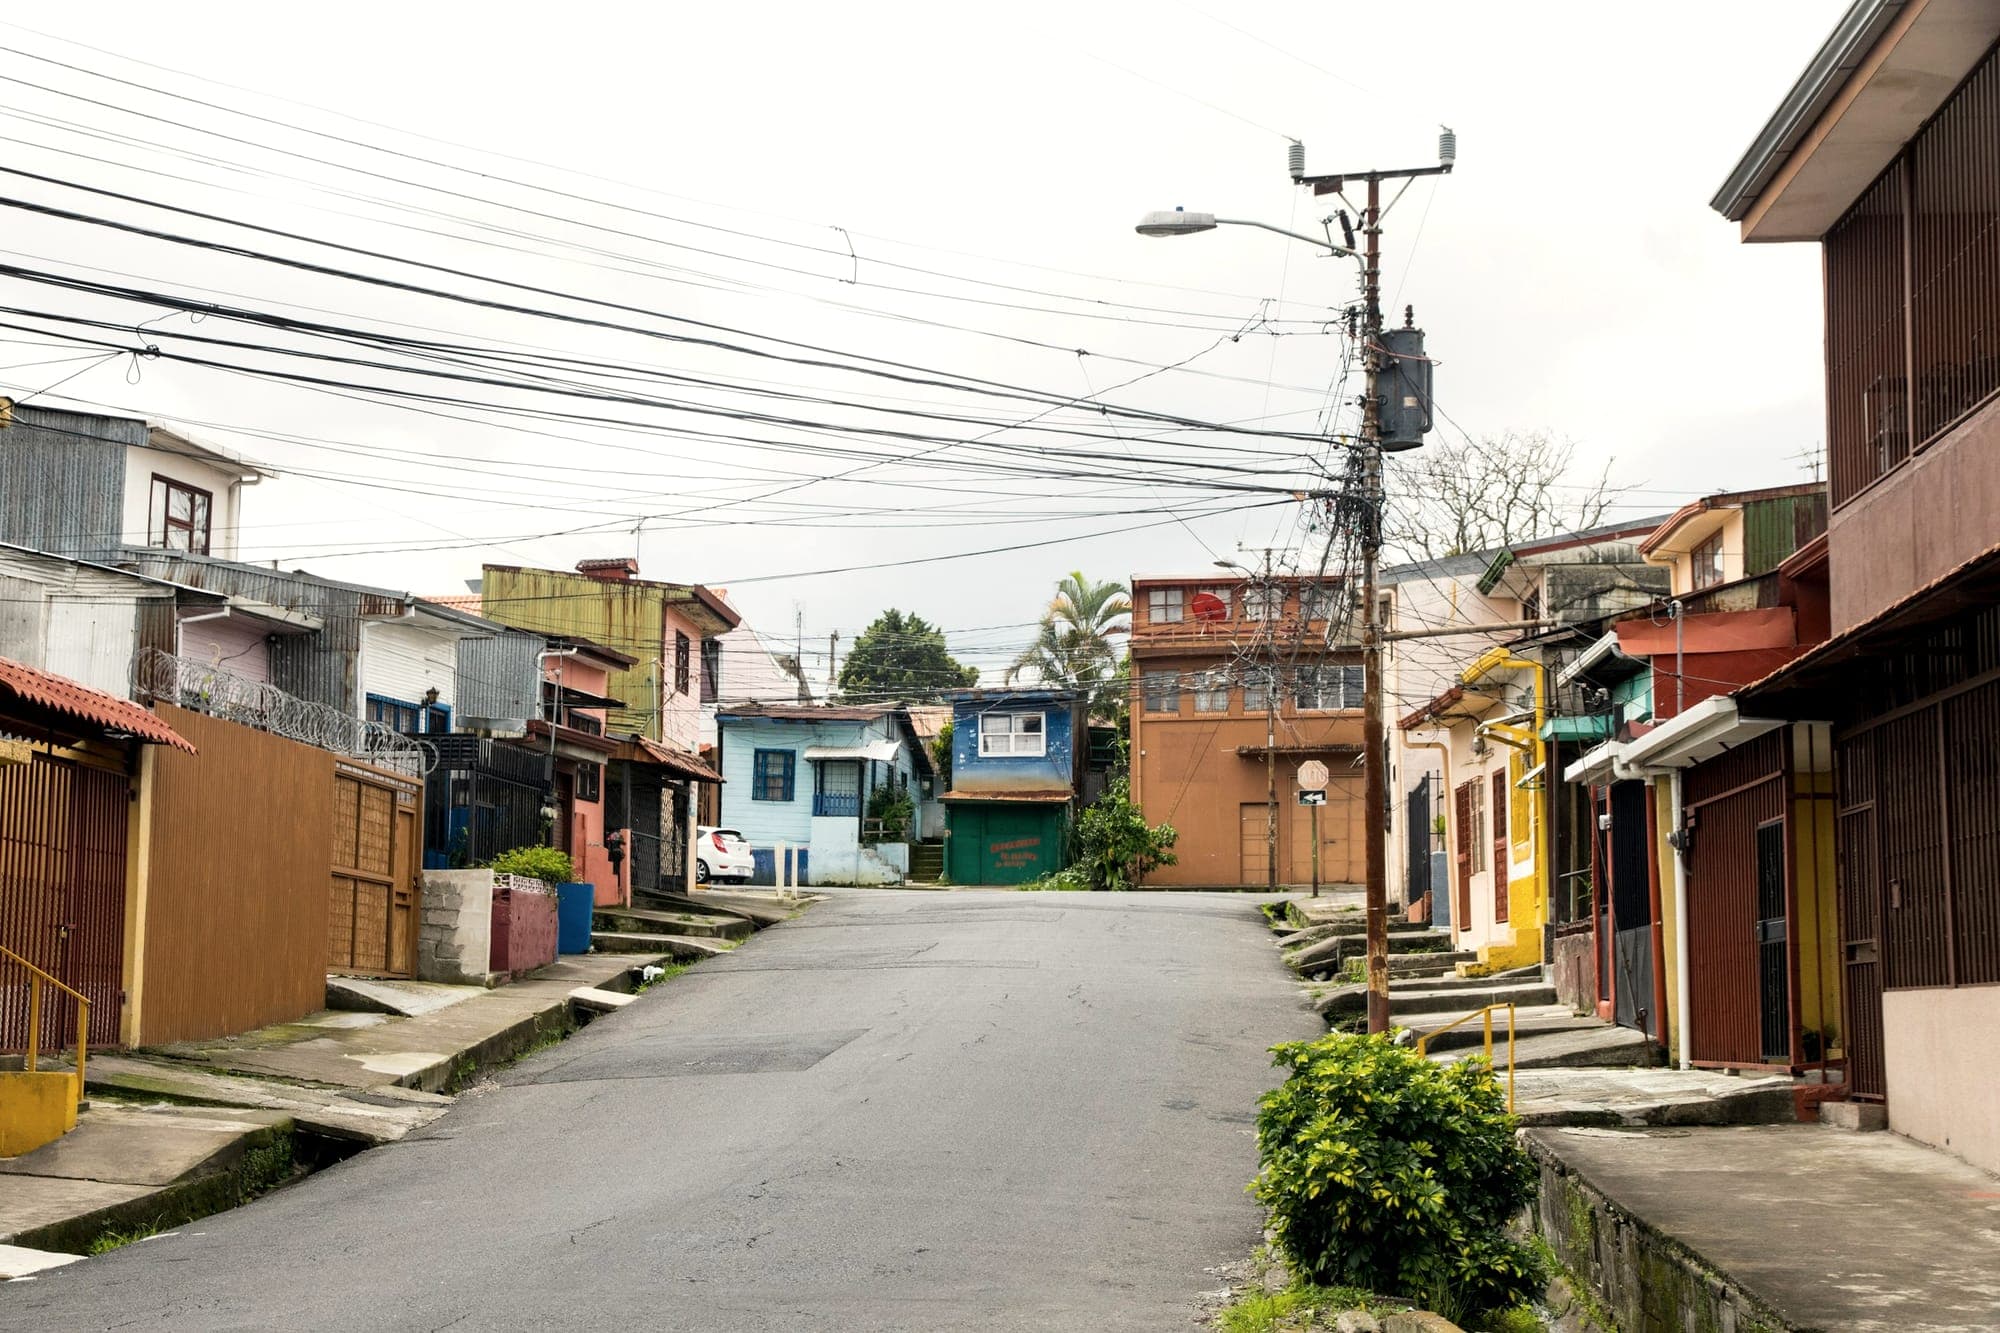
Photo: Kirill Iudin / Unsplash · Georgia

Market watch · 62

Rural Georgia has less unemployment and twice the self-employment

The unemployment rates differ by 4.5 points and the employment rates by 1.0, so what separates the two places is not how many adults work but what kind of job the work is.

Geostat publishes hired work and self-employment as two categories inside one count of employed people, and the ILO classification that defines them treats what a household consumes of its own produce as part of the profits of a self-employment job. That is why a place can report less unemployment and far less paid employment at the same time. Here is how rural and urban Georgia divide one national count of workers, why the unemployment rate cannot see the difference, and why the same table cutting the same count by sex gives the opposite pairing.

11.2%the unemployment rate in rural Georgia in 2025, on a labour force of 650,400
15.7%the urban unemployment rate the same year, 4.5 points above the rural one
44.8%of rural employment is self-employment, against 20.6% in urban areas

44.8% of rural employment is self-employment, against 20.6% in the cities

Rural, self-employed44.8%
Rural, hired55.2%
Urban, self-employed20.6%
Urban, hired79.1%
How the employed people of rural and urban Georgia divide between hired work and self-employment in 2025, each bar as a percent of that area's own employed. Urban and rural are one cut of a single national count of 1,389,700 employed people, and they are the only cut shown here. The two bars of each area fall just short of 100% because Geostat publishes a third category, "not-identified worker", holding 300 people in rural areas and 2,000 in urban ones. SELF-EMPLOYMENT IS EMPLOYMENT: every person in all four bars holds a job by the definition the survey uses, and none of them is counted as unemployed. Nothing in this chart says what any of the work is, what it pays, or whether anybody would prefer a different kind of it. National Statistics Office of Georgia, Labour Force Survey, read 14 November 2026.

One count of workers, cut by who they work for

In 2025 Georgia counted 1,389,700 people as employed, and Geostat cuts that one count by the kind of job each of them holds. 961,100 were hired, 426,300 were self-employed, and 2,300 fell into a third category the office calls a not-identified worker. The three add to the total exactly.

Self-employment is employment, and the classification that defines it says so in a parenthesis worth reading. ICSE-93 calls a job self-employment when the pay depends on the profits of the enterprise, and it adds that own consumption counts as part of those profits. Somebody producing on their own holding for their own household is therefore holding a job.

And an unemployment rate can only see the people who hold no job at all. It counts those who are without work, available to start, and actively looking, all three at once. So however much of a country's work is self-employment, none of it can show up in that rate.

Provenance: SourceWhat the survey counts
  1. SELF-EMPLOYMENT IS EMPLOYMENT, AND THE DEFINITION IS EXPLICIT ABOUT WHY. ICSE-93, adopted by the Fifteenth International Conference of Labour Statisticians on 28 January 1993, separates jobs into paid employment and self-employment. Paragraph 6 defines a paid-employment job as one whose basic remuneration is not directly dependent on the revenue of the unit worked for. Paragraph 7 defines a self-employment job as one where the remuneration depends directly on the profits derived from the goods and services produced, and it adds, in its own parenthesis, that own consumption is considered to be part of profits. A person producing on their own holding for their own household therefore holds a job under this classification, and holding a job is what makes someone employed.
  2. TO BE COUNTED UNEMPLOYED IS TO BE WITHOUT WORK, AVAILABLE, AND LOOKING. All three at once. Somebody who is self-employed is not without work, so no amount of self-employment can raise an unemployment rate, whatever anybody thinks of the work. And somebody without work who is not looking is outside the labour force and is in neither the numerator nor the denominator of the rate. This is the single fact that makes a low unemployment rate compatible with very little hired work.
  3. HIRED AND SELF-EMPLOYED ARE GEOSTAT'S OWN TWO CATEGORIES, INSIDE ONE COUNT. The table publishes eleven economic-status rows, and "hired" and "self-employed" are both of them subdivisions of "employed", alongside a third, "not-identified worker", that holds a few hundred people. The three add to the published count of employed people exactly, in every group and in both periods read. So the composition below is a cut of one number and not two numbers put beside each other.
  4. A RATE OF THE LABOUR FORCE IS NOT A SHARE OF THE EMPLOYED. 11.2% is the unemployed people of rural Georgia divided by its labour force, which is everybody there who is employed plus everybody who is unemployed. 44.8% is the self-employed people of rural Georgia divided by its employed. The denominators are different numbers and the two figures answer different questions; neither can be computed from the other without the counts, and this edition prints the counts.
  5. THE EMPLOYMENT RATE HERE IS ON THE POPULATION AGED 15 AND OVER, WITH NO UPPER LIMIT. That is how Geostat publishes this table. A rate built on ages 15 to 64, which is how Eurostat and many national offices publish theirs, is a different measure on a different denominator, and this edition makes no comparison with any such figure and names no other country.
  6. URBAN AND RURAL, AND FEMALE AND MALE, ARE TWO SEPARATE CUTS OF ONE COUNT. Urban plus rural is Georgia and female plus male is Georgia, and the identities hold in the published figures. But no published cell crosses the two, so nothing in this edition says anything about rural women, urban men, or any combination of the two cuts. The one is used as a check on the other and never as a way through it.

So this table says how the employed people of rural and urban Georgia divided between two kinds of job in 2025, what the three published rates were for each area, how the sign of both comparisons held across every published year, and nothing about why, about what any of the work is, or about what anybody doing it would rather be doing.

One count of employed people, cut by what kind of job each person holds, and a rate that can only see the people who hold none. A reading that treats self-employment as a milder form of unemployment, or that gives employment and paid employment the same name, says what this table does not.

258,700 of rural Georgia's 577,800 workers are self-employed

Of the 577,800 people employed in rural Georgia, 258,700, which is 44.8%, were self-employed and 318,800 were hired. In urban Georgia the same cut reads 167,600 self-employed out of 811,900, or 20.6%, against 642,300 hired. The rural share is more than twice the urban one.

The two areas are one cut of a single national count, which is what makes the comparison a comparison. 811,900 plus 577,800 is the 1,389,700 employed people of the country, and 642,300 plus 318,800 is its 961,100 hired jobs. Neither figure is an estimate laid beside another estimate; they are two parts of one published number.

The remaining category is small and it is named rather than absorbed. The not-identified workers are 300 people in rural areas and 2,000 in urban ones, which is why the two shares of each area come to 99.9% and 99.8% rather than exactly 100%.

Provenance: Source
The employed people of rural and urban Georgia in 2025 by status in employment, aged 15 and over: the published count in each of Geostat's three categories and that category as a percent of the area's own employed. The three categories add to each area's published total exactly. "Hired" and "self-employed" are Geostat's own labels for two kinds of job inside ONE count of employed people, and ICSE-93 separates them by whether the pay depends on the profits of the enterprise rather than by whether the work is paid at all. The percentages are this edition's own division of two published counts, rounded once. Urban and rural are one cut of a single national count and the figures for the two add to Georgia's. National Statistics Office of Georgia, Labour Force Survey, read 14 November 2026.
Status in employmentRural areasUrban areasPercent of rural employedPercent of urban employed
Hired318,800642,30055.2%79.1%
Self-employed258,700167,60044.8%20.6%
Not-identified worker3002,0000.1%0.2%

The lower rate, and the employment rate that is almost the same

Rural Georgia's unemployment rate was 11.2% and urban Georgia's 15.7%, a difference of 4.5 points. That is the rate a reader meets first, and on its own it says rural Georgia has less unemployment than urban Georgia, which is exactly what it says and all that it says.

The employment rate, which asks a different question, puts the two places 1.0 point apart. 46.3% of rural adults aged 15 and over were in work against 47.3% of urban adults. So nearly the same proportion of adults was working in the two areas while the rates that describe looking for work were four and a half points apart.

What differs is the kind of job, and the participation rate is where the two rates part company. 52.2% of rural adults were in the labour force against 56.1% of urban adults, so the rural labour force is smaller relative to its population. A rate whose denominator is the labour force and a rate whose denominator is the population are not two versions of one measure.

Provenance: Source
THE FOUR MEASURES SIDE BY SIDE, Georgia 2025, which is the whole argument in one table. The first three columns are published rates and are printed as published; the fourth is this edition's division of two published counts. The unemployment rate divides the unemployed by the labour force, the participation rate divides the labour force by the population aged 15 and over, and the employment rate divides the employed by that same population. Read across the rural row and the urban one: the unemployment rates are 4.5 points apart while the employment rates are 1.0 point apart, so nearly the same proportion of adults is in work in the two places and the rates that describe looking for work are not. The last column is what differs, and it is a share of a different denominator from any of the others. National Statistics Office of Georgia, Labour Force Survey.
Reporting groupUnemployment rateParticipation rateEmployment rateSelf-employed, percent of employed
Georgia13.9%54.5%46.9%30.7%
Urban areas15.7%56.1%47.3%20.6%
Rural areas11.2%52.2%46.3%44.8%

Sixteen printed years, and the gap never changes sign

In every one of the sixteen years from 2010 to 2025 the rural unemployment rate is below the urban one, and the rural self-employed share is above the urban one. The size of both gaps moves a great deal: the rate gap is 6.3 points in 2010, 1.1 points in 2024 and 4.5 points in 2025, and the rural self-employed share falls from 62.8% to 44.8% over the sixteen years while the urban share moves within a narrow band, 20.9% in 2010, down to 16.7% in 2017 and back to 20.6% in 2025.

The series runs back to 1998 and this edition does not read across it. Between 2009 and 2010 rural employment falls from 900,500 to 504,200, rural self-employment from 745,200 to 316,700, and the rural unemployment rate rises from 7.6% to 23.5%. No annual change does that. The API carries no comment, no footnote and no methodological note of any kind, so the movement is reported and not explained, and no level in this edition is compared across those two years.

What does hold over all twenty-eight published years is the sign, because the sign is a comparison made inside each year. Rural below urban on the rate in twenty-eight of twenty-eight; rural above urban on the self-employed share in twenty-eight of twenty-eight. A change in how a survey is drawn or weighted changes levels; it does not retrospectively reverse which of two figures measured in the same year by the same survey was the larger.

Provenance: Source
The sixteen years from 2010 to 2025: the unemployment rate in each area and the self-employed share of each area's employed. The table is here because one year could be a year chosen to suit the finding. IT STARTS AT 2010 AND THAT DELIMITATION IS THIS EDITION'S OWN. Geostat publishes this table back to 1998, and between 2009 and 2010 the rural figures move in a way no annual change explains: rural employment from 900,500 to 504,200, rural self-employment from 745,200 to 316,700, and the rural unemployment rate from 7.6% to 23.5%. The API carries no comment, no footnote and no methodological note, and none was opened, so NO LEVEL IS COMPARED ACROSS THOSE TWO YEARS and nothing here is called a record. What holds over all twenty-eight published years, because it is a comparison WITHIN each year, is the sign: the rural rate is below the urban rate in every one of them, and the rural self-employed share is above the urban one in every one of them. The rate columns are published; the share columns are derived from two published counts. National Statistics Office of Georgia, Labour Force Survey.
YearUrban unemployment rateRural unemployment rateUrban self-employed shareRural self-employed share
201029.8%23.5%20.9%62.8%
201130.7%22.0%17.8%64.8%
201229.7%22.4%17.3%62.6%
201329.9%21.3%20.3%60.1%
201426.1%18.3%18.3%59.9%
201525.5%16.3%18.0%56.5%
201624.8%16.9%16.9%57.0%
201725.1%16.4%16.7%53.1%
201820.4%17.6%17.1%49.0%
201918.2%16.7%17.1%50.3%
202020.3%15.8%18.2%51.7%
202122.2%18.2%18.3%51.2%
202218.3%15.7%20.3%48.8%
202317.6%14.6%20.0%47.1%
202414.4%13.3%21.9%45.8%
202515.7%11.2%20.6%44.8%

Women have the lower rate and less self-employment

The same table cuts the same national count by sex, and the pairing inverts. Women's unemployment rate was 11.4% against men's 15.8%, the lower rate, as rural areas have the lower rate. But women's self-employed share was 20.9% against men's 38.5%, the LOWER share, where rural areas have the higher one.

That is why this edition states its finding of the urban and rural cut and of nothing wider. If a lower unemployment rate came with more self-employment as a rule, the sex cut of the very same count would show it, and it shows the opposite. One cut of one country in one year is the whole territory of the claim.

And the third reading in the table is the one that should temper all of them. 44.2% of women aged 15 and over were in the labour force against 66.3% of men. Two unemployment rates computed on labour forces that different are each exact about their own denominator and say correspondingly less when set side by side.

Provenance: Source
THE COUNTER-CASE, and it is why this edition states its finding of the urban and rural cut only. The same table cuts the same national count a second way, by sex, and the pairing inverts. Women have the lower unemployment rate, 11.4% against 15.8%, just as rural areas do; but women have the LOWER self-employed share, 20.9% against 38.5%, where rural areas have the higher one. So "a lower unemployment rate comes with more self-employment" is not a rule, and no sentence in this edition says it is. The participation column is the third reading that belongs here: 44.2% of women aged 15 and over are in the labour force against 66.3% of men, and a rate computed on a smaller labour force is not comparable with one computed on a larger as a measure of anything but itself. SEX AND AREA ARE TWO SEPARATE CUTS OF ONE COUNT and no published cell crosses them, so nothing here says anything about rural women or urban men. National Statistics Office of Georgia, Labour Force Survey.
Reporting groupUnemployment rateSelf-employed, percent of employedParticipation rate
Georgia13.9%30.7%54.5%
Women11.4%20.9%44.2%
Men15.8%38.5%66.3%

What these figures do not say

They do not say that rural Georgia's labour market is healthier, or that urban Georgia's is worse. The unemployment rate is lower in rural areas and that is the finding; what kind of work the employed are doing, what it pays, how secure it is and whether anybody would prefer different work are all outside everything read here. Geostat publishes the status of the job and the count of the people, and this edition read no earnings figure, so it names none.

They do not say that self-employment is unemployment under another name, or a milder form of it. Under the classification the survey uses, a self-employment job is a job: paragraph 7 of ICSE-93 defines it by the dependence of the pay on the profits of the enterprise, counting own consumption as part of those profits, and nothing in the definition turns on whether the holder would rather be hired. Nor do they say the reverse, that the two kinds of job are interchangeable. The edition prints the two counts and the definition and makes neither judgement.

They do not say that one of these figures causes the other. No published cell crosses status in employment with looking for work, so the sentence that the rural rate is low because so much rural work is self-employment is not demonstrable from anything read here, however reasonable it sounds, and it is not written. Nor is any other cause named: not agriculture, not migration, not education, not the structure of the economy, and not policy of any kind.

They do not say that rural self-employment is farming. Agriculture, forestry and fishing employed 218,300 of the 1,389,700 people in work in 2025, 15.7% of employment, while self-employment is 30.7% of the same count, so self-employment is about twice the size of the whole of agriculture. And the activity table has neither an urban and rural dimension nor a status-in-employment one: the two cuts cannot be crossed, so what rural self-employed people actually do is not in this edition at all.

They do not say that 11.2% is a record low or 44.8% a record high. Twelve of the twenty-eight published years carry a lower rural unemployment rate than 11.2%, all of them before the discontinuity the edition refuses to read across, so 11.2% is the lowest of the sixteen printed years and nothing more. The rural self-employed share is at its lowest of those sixteen years, not its highest, having fallen from 62.8% in 2010. And they do not say anything the edition did not read: nothing here is broken out by age, region, occupation, education or earnings; the two periods printed are an annual average and a single quarter and are never mixed in one sentence; no other country appears; nothing is a forecast; and no figure in this edition comes from our own platform.

What this means for you

If you are hiring in Georgia

The number of people in the country who are counted as unemployed is 224,000, and 72,600 of them are in rural areas against 151,400 in urban ones. The rural figure is the smaller of the two even though rural Georgia holds 1,246,800 adults, because most rural adults who are working are working for themselves: 258,700 of the 577,800 employed there are self-employed and only 318,800 are hired. A search that reads a low local unemployment rate as a thin pool of available people is reading a rate whose denominator is the labour force, not a count of who might move. Nothing in this table says what any of these people can do: Geostat publishes the status of the job and the count of the people, and this edition read nothing about occupation, education or skill, none of which it is entitled to comment on. The figures are weighted estimates from a sample survey, not a register.

If you are looking for work in Georgia

Where you are changes what the local figures mean rather than how hard the search is. In rural areas 55.2% of the people in work are hired by somebody and 44.8% work for themselves; in urban areas those are 79.1% and 20.6%. So the same national count of 961,100 hired jobs is distributed very unevenly, 642,300 of them urban and 318,800 rural, while the share of adults in work is almost identical in the two places. The unemployment rate counts you only if you are without work, available to start and actively looking, so it says who is searching and never whether the work other people have is the kind you are searching for. None of these figures predicts anything about any individual search, including yours.

How this was counted

Method

  1. THE READ. Two tables from the National Statistics Office of Georgia's keyless PxWeb dissemination API, requested as JSON on 14 November 2026 at 19:28 UTC. LFS_by_sex_and_urban_(Quarter_II,_2026).px, "Labour Force Indicators by Sex, Urban/Rural Areas, Years and Quarters", last updated 19 August 2026: eleven economic-status rows by five reporting groups by twenty-nine years by five period columns, 7,975 observations. Employment_by_branch_(NACE_Rev2).px, "Distribution of employed persons by economic activity (Nace rev. 2) and sex", last updated 11 May 2026, 360 observations. Both responses were saved before anything was written. The API answers a table's metadata only on a URL ENDING IN A SLASH; without it the same path returns 404, and a path with the ".px" removed silently returns the top of the database instead, which is a 200 that answers a different question. That is a fact about the connection and not about the data.
  2. THE SECOND TRANSCRIPTION PATH, AND IT IS A CONTROL RATHER THAN A SOURCE. The office's own Employment and Unemployment page prints the headline series as a small table: labour force, employed, unemployed and the unemployment rate for 2022, 2023, 2024, 2025 and the first and second quarters of 2026. All twenty-four of those cells match the API cell for cell, 1,613,700 and 13.9% for 2025 among them. A transcription error on the way out of the API would have to be the same error on a hand-built web page to survive that.
  3. THE DEFINITIONS WERE READ, NOT PARAPHRASED. ICSE-93, the resolution adopted by the Fifteenth International Conference of Labour Statisticians on 28 January 1993, was read in full from the ILO's own PDF, paragraphs 5 to 10. Paragraph 6 defines a paid-employment job by remuneration that is not directly dependent on the revenue of the unit; paragraph 7 defines a self-employment job by remuneration that depends directly on the profits derived from the goods and services produced, and states in its own parenthesis that own consumption is considered part of those profits. The parenthesis is the load-bearing sentence of this edition and it is quoted rather than summarised.
  4. EVERY PUBLISHED RATE RECOMPUTED FROM THE PUBLISHED LEVELS. Thirty cells: the unemployment, participation and employment rates for each of the five reporting groups in each of the two periods, each divided out from the levels that make it. All thirty land on the published figure, the worst cell differing by 0.05 of a point. THE TOLERANCE IS 0.06 AND IT COMES FROM THE ROUNDING, not from a guess: the published rate is itself given to one decimal, so half of 0.1 is already 0.05 before anything else, and the levels being rounded to the nearest hundred people adds about 0.003 of a point at these magnitudes. A tolerance of 0.05 would redden a healthy page on the participation rate.
  5. THE IDENTITIES, AND THE RESIDUALS. Five of them, checked for every group in both periods, sixty-two checks in all: hired plus self-employed plus not-identified is the employed; employed plus unemployed is the labour force; labour force plus population outside it is the population aged 15 and over; urban plus rural is Georgia; female plus male is Georgia. Fifty-one came out exact and the rest land 100 people away, in both directions, because Geostat rounds every cell to the nearest hundred people independently. The worst residual anywhere is 100 people. The composition this edition prints in full, the three statuses of each area in 2025, is exact in both areas.
  6. THE SIGN CLAIM IS MADE OVER ALL TWENTY-EIGHT PUBLISHED YEARS AND THE TABLE PRINTS SIXTEEN, deliberately. A comparison between two figures measured in the same year by the same survey cannot be reversed by a later change of method, so the sign is asserted over 1998 to 2025: the rural unemployment rate is below the urban one in twenty-eight of twenty-eight years, and the rural self-employed share is above the urban one in twenty-eight of twenty-eight. LEVELS ARE A DIFFERENT MATTER. Between 2009 and 2010 rural employment falls from 900,500 to 504,200, rural self-employment from 745,200 to 316,700 and the rural unemployment rate rises from 7.6% to 23.5%, which no annual change explains. The API carries no comment, footnote or methodological note, and none was opened, so the movement is reported and not explained, no level is compared across it, and the series table starts at 2010. That delimitation is this edition's own and is labelled as such wherever it appears.
  7. DERIVED FIGURES, NAMED. Published and printed as published: every level in thousands of people, and the unemployment, participation and employment rates. Derived here, by dividing two published counts and rounding once: every self-employed share and hired share, 44.8% and 20.6% and 55.2% and 79.1% among them, the 30.7% national self-employed share, the 15.7% agriculture share, and the statement that the rural share is more than twice the urban one, which is 2.17 before rounding. EVERY POINT CHANGE IS THE DIFFERENCE OF THE TWO ONE-DECIMAL FIGURES PRINTED BESIDE IT, so a reader repeating the subtraction lands on the same answer: the 4.5 points between 15.7% and 11.2%, where the unrounded values give 4.56, and the 1.0 point between 47.3% and 46.3%.
  8. WHAT WAS TESTED AND REFUSED. That 11.2% is a record low: twelve of the twenty-eight published years are lower, all before the discontinuity, so it is called the lowest of the printed sixteen. That the rural self-employed share is at a high: it is at its LOWEST of those sixteen years, down from 62.8% in 2010. That a lower unemployment rate comes with more self-employment: the sex cut of the same count inverts the pairing, women having both the lower rate and the lower self-employed share, and the counter-case is printed in a table of its own. That rural self-employment is subsistence agriculture: the activity table has no urban and rural dimension and no status dimension, so the two cuts cannot be crossed, and agriculture at 15.7% of employment is about half the size of self-employment at 30.7%. And any cause for any figure: no published cell crosses status in employment with looking for work, so none is named.
  9. LIMITS. Nothing here names a cause, follows a person, crosses the two cuts of the count, or reaches across the discontinuity between 2009 and 2010. No figure is broken out by age, region, occupation, education or earnings, none of which was read for this edition, and two further tables of this database, by region and by age group, were fetched and are not used, so nothing here rests on them. An annual average and a single quarter are both printed and are never combined in one sentence. The employment and participation rates are on the population aged 15 and over with no upper limit, which is not the 15 to 64 denominator other offices use, and no comparison is made with any other country. The counts are weighted estimates from a sample survey published to the nearest hundred people, not a register of jobseekers. And no figure in this edition comes from our own platform.

What the data establishes, and what it does not

What the data establishes

  • In 2025 the unemployment rate in rural Georgia was 11.2% and in urban Georgia 15.7%, a difference of 4.5 points on the published figures.
  • In the same year 258,700 of the 577,800 people employed in rural areas, 44.8%, were self-employed, against 167,600 of 811,900, or 20.6%, in urban areas, which is more than twice the share.
  • The two areas' employment rates are 1.0 point apart, 46.3% rural against 47.3% urban, so nearly the same proportion of adults aged 15 and over was in work in each.
  • In every one of the twenty-eight annual years Geostat publishes, the rural unemployment rate is below the urban one and the rural self-employed share is above the urban one.
  • The same table cut by sex inverts the pairing: women have both the lower unemployment rate, 11.4% against 15.8%, and the lower self-employed share, 20.9% against 38.5%.

What it does not

  • That rural Georgia's labour market is healthier than urban Georgia's, or that self-employment is unemployment under another name: under ICSE-93 a self-employment job is a job, and nothing read here describes what any of the work is or pays.
  • That the self-employment explains the lower rate, or that any figure here causes any other: no published cell crosses status in employment with looking for work, so the connection is not demonstrable from anything read.
  • That rural self-employment is farming: agriculture, forestry and fishing is 15.7% of national employment against self-employment's 30.7%, and the activity table has neither an urban and rural nor a status dimension, so the two cuts cannot be crossed.
  • That 11.2% is a record low: twelve of the twenty-eight published years are lower, all of them before the discontinuity between 2009 and 2010, so it is the lowest of the sixteen printed years and nothing more.
  • That the rural self-employed share is at a high: it is at its lowest of those sixteen years, having fallen from 62.8% in 2010.
  • Anything about the years before 2010 as levels, or about why the rural figures move as they do between 2009 and 2010: the API carries no methodological note, none was opened, and the movement is reported rather than explained.
  • Anything about rural women or urban men, since sex and area are two separate cuts of one count and no published cell crosses them; and nothing about age, region, occupation, education, earnings, any other country, or any year to come.
Primary sources

BabZituna scores every job against your profile on six real dimensions, and publishes what it can and cannot measure. See the live market.

Earlier editions