Skip to content
Sign inGet started free
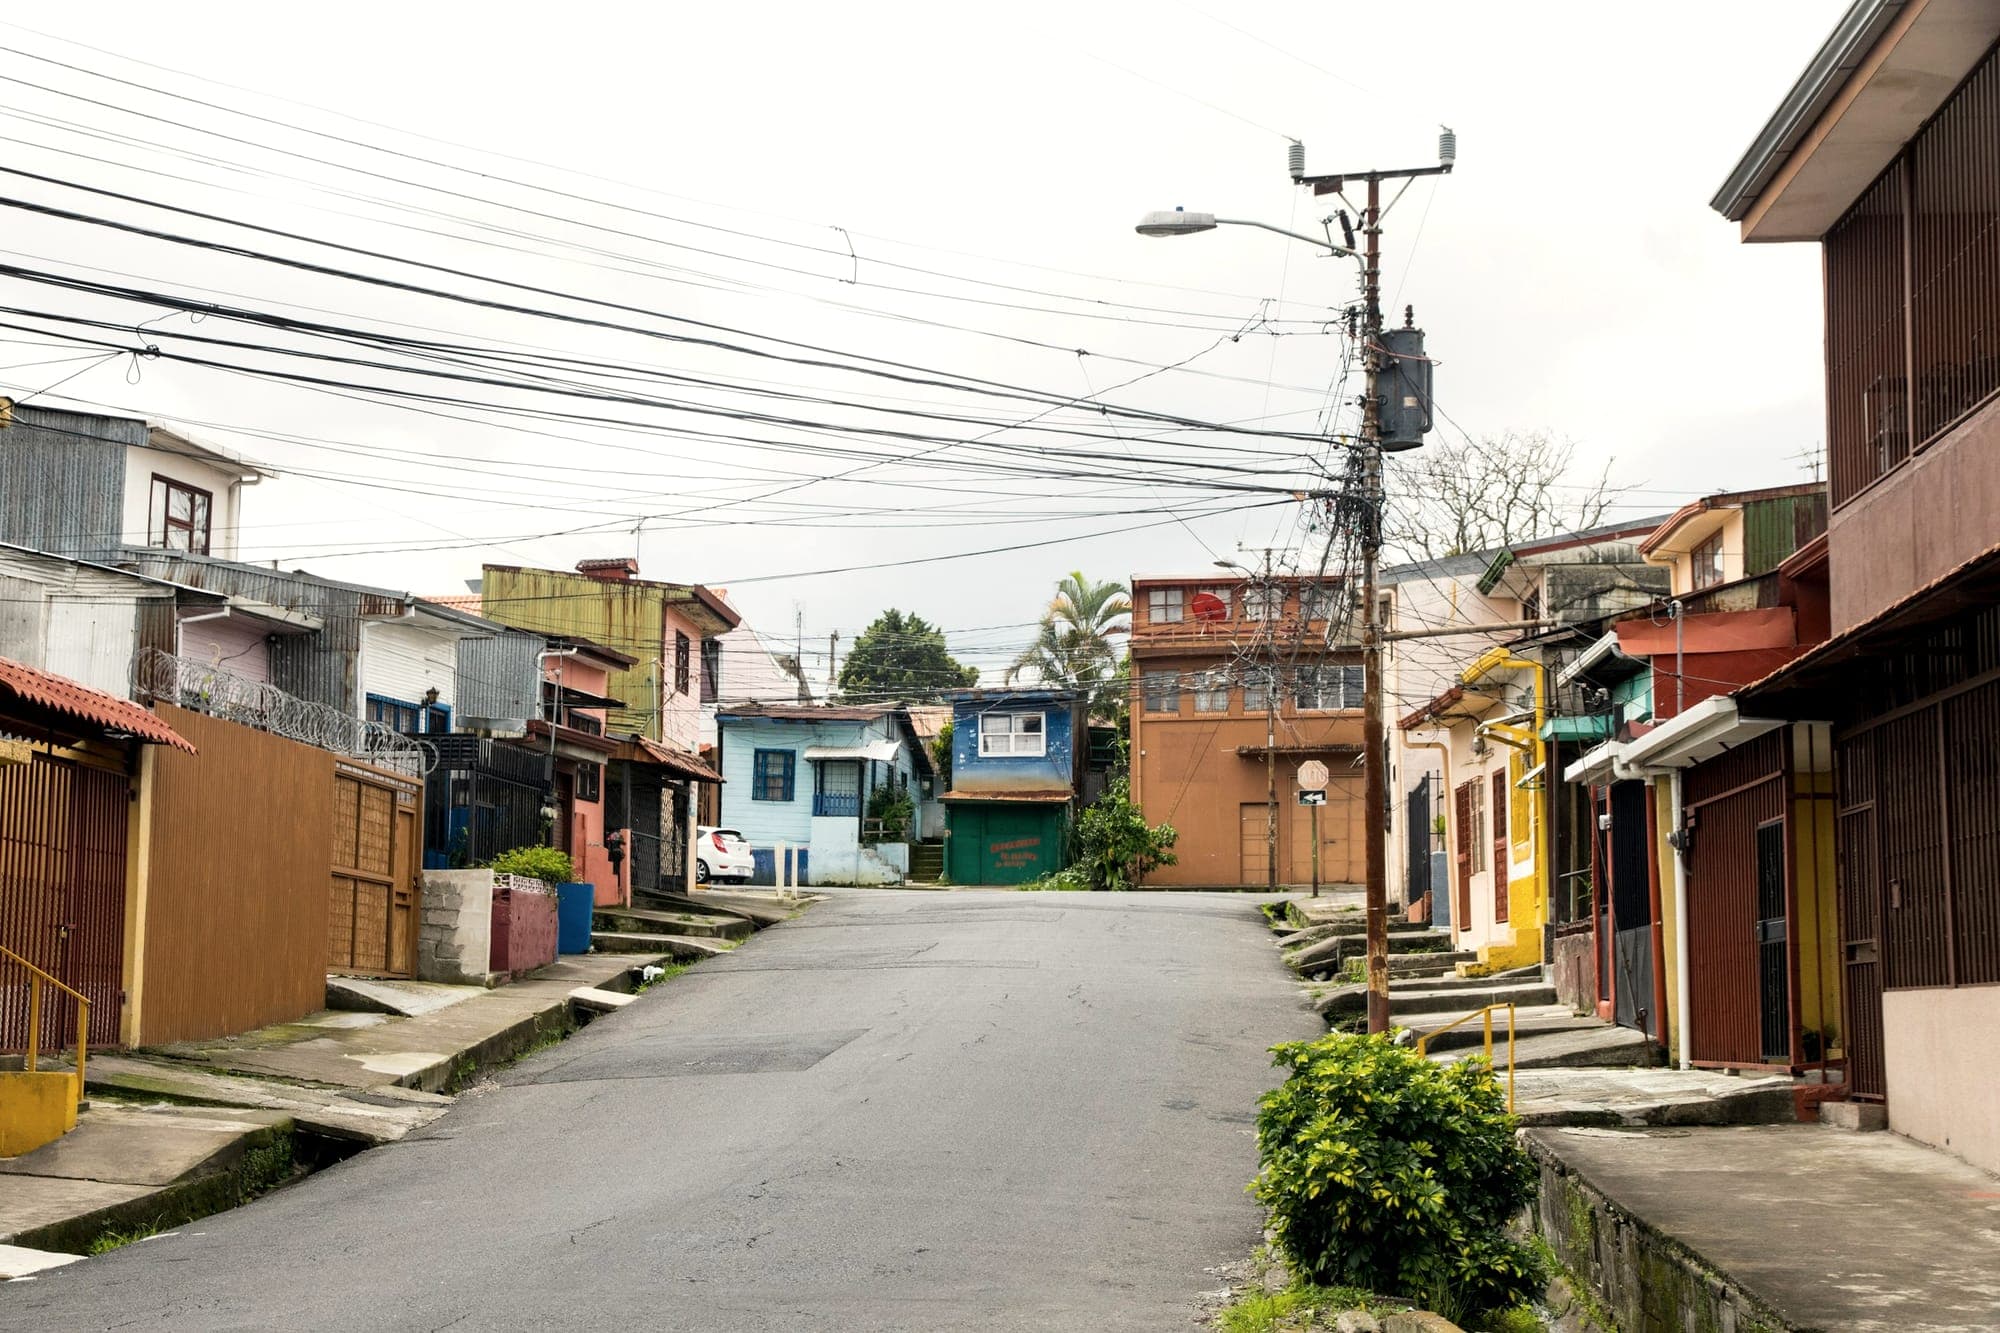
Photo: Robin Canfield / Unsplash · Costa Rica

Market watch · 65

Costa Rica's unemployment fell 44% while its employment rate fell

The unemployment rate and the employment rate are divided by different populations, and in Costa Rica both are lower than in 2019.

An unemployment rate can fall because people found work, and it can fall because fewer people are looking. Costa Rica's fell by 4.9 points in seven years while the share of adults in work fell by 3.4 points. Here is what the survey counts as unemployed, what moved between the same quarter of 2019 and of 2026, how the picture differs for men, for women and for people aged 15 to 64, and what eight years of the same quarter show.

11.4%unemployment rate in Costa Rica, July to September 2019
6.5%unemployment rate in the same quarter of 2026
51.3%of people aged 15 and over employed in July to September 2026, against 54.7% in 2019

The unemployment rate fell by 4.9 points and the employment rate by 3.4

Unemp. rate 201911.4%
Unemp. rate 20266.5%
Empl. rate 201954.7%
Empl. rate 202651.3%
Costa Rica, July to September 2019 and July to September 2026. THE TWO RATES HAVE DIFFERENT DENOMINATORS: the unemployment rate is the unemployed as a percentage of the labour force, and the employment rate is the employed as a percentage of the population aged 15 and over. The bars are percentages and start at zero. All four values are printed as the Instituto Nacional de Estadística y Censos publishes them, to one decimal, in its report on the third quarter of 2026. Encuesta Continua de Empleo, read 18 November 2026.

A person can leave unemployment without finding a job

Costa Rica's statistics office sorts everyone aged 15 and over into three groups: employed, unemployed, and outside the labour force. Its household survey, the Encuesta Continua de Empleo, has done so every quarter since July to September 2010.

To be counted as unemployed a person has to be without work, available for it and, with three listed exceptions, searching. Someone who has taken no step to find work in four weeks is counted outside the labour force instead.

That is why the unemployment rate alone cannot say whether more people are working. It is a share of the labour force, and the labour force itself can shrink. The employment rate is a share of everyone aged 15 and over, a population that nobody leaves by giving up a search.

Provenance: SourceWhat the survey counts
  1. WHO IS EMPLOYED. The report defines the employed as people in the labour force who took part in producing goods or services for at least one hour in the reference week, together with those who had a job but were away from it for a special reason, were guaranteed to return and were absent for no more than a month.
  2. WHO IS UNEMPLOYED. People without employment in the reference week who were available to work and took concrete steps to look for work during the last four weeks. The report adds three cases counted as unemployed without a search: those who have found a job and are waiting to start it, those waiting for a suspended activity to restart, and those waiting for an answer to earlier steps.
  3. WHO IS OUTSIDE THE LABOUR FORCE. People aged 15 and over who were not employed in the reference week and took no step to find work in the four weeks before the interview. The report divides them into those not available for work, those available with limitations and those available but discouraged.
  4. THE UNEMPLOYMENT RATE DIVIDES BY THE LABOUR FORCE. It is the unemployed as a percentage of the labour force, which is the employed plus the unemployed. People outside the labour force are in neither the top nor the bottom of that fraction.
  5. THE EMPLOYMENT RATE DIVIDES BY EVERYONE AGED 15 AND OVER. The report defines it as the employed as a percentage of the population of working age, which it sets at 15 and over with no upper limit. So a person of 80 who does not work is in its denominator.

So these figures say how many people the survey placed in each of three groups in one quarter of 2019 and in the same quarter of 2026, and nothing about which person moved from one group to another, or why.

Three groups make up everyone aged 15 and over, and a person leaves the unemployed by entering either of the other two. A reading that treats a fall in unemployment as a rise in employment says what this survey does not.

123,372 fewer unemployed, and 47,716 more employed

From July to September 2019 the survey counted 278,108 unemployed people, and in the same quarter of 2026 it counted 154,736. That is 123,372 fewer, a fall of 44%.

The count of the employed went from 2,162,613 to 2,210,329, which is 47,716 more. That difference is smaller than the survey's own margin: the office's 95% confidence interval for the 2026 count runs from 2,132,499 to 2,288,159, and the 2019 count lies inside it.

The population aged 15 and over grew by 359,112, from 3,951,379 to 4,310,491, and the count of people outside the labour force grew by 434,768, from 1,510,658 to 1,945,426. The three changes add up exactly: 47,716 more employed, 123,372 fewer unemployed and 434,768 more outside the labour force make 359,112 more people. More people were added outside the labour force than were added to the population.

Provenance: Source
THE SAME QUARTER, SEVEN YEARS APART. People aged 15 and over in Costa Rica by labour force status, July to September 2019 and July to September 2026, and the change. THE TWO COLUMNS OF COUNTS ARE PUBLISHED; THE CHANGE IS A SUBTRACTION MADE HERE. The three changes below the first row add up exactly to the change in the population, because the three groups are the whole of it. The 2026 counts are the Instituto Nacional de Estadística y Censos's own table; the 2019 counts are the same survey as transcribed in the OECD's infra-annual labour statistics, read 18 November 2026.
Labour force statusJuly to September 2019July to September 2026Change (derived here)
Population aged 15 and over3,951,3794,310,491+359,112
Employed2,162,6132,210,329+47,716
Unemployed278,108154,736-123,372
Outside the labour force1,510,6581,945,426+434,768

Two rates fell together

The unemployment rate fell from 11.4% to 6.5%, a fall of 4.9 points. Both figures are the office's own, printed to one decimal.

The employment rate fell from 54.7% to 51.3%, a fall of 3.4 points. The office's 95% confidence interval for the 2026 rate runs from 49.8% to 52.8%, and the 2019 rate is above its upper end.

The participation rate, which is the labour force as a share of everyone aged 15 and over, went from 61.8% to 54.9%. Its mirror image, the non-participation rate, went from 38.2% to 45.1%. Each moved by 6.9 points, more than either of the other two rates.

Provenance: Source
FOUR PUBLISHED RATES, TWO DENOMINATORS. The unemployment rate divides the unemployed by the labour force. The employment rate, the participation rate and the non-participation rate each divide by the population aged 15 and over. The rates are printed as the office publishes them, to one decimal; the change in points is a subtraction of the printed values made here. Instituto Nacional de Estadística y Censos, general results report for the third quarter of 2026.
RateJuly to September 2019July to September 2026Change in points (derived here)
Unemployment rate11.4%6.5%-4.9
Employment rate54.7%51.3%-3.4
Participation rate61.8%54.9%-6.9
Non-participation rate38.2%45.1%+6.9

Women: 85,584 fewer unemployed and 1,080 more employed

Among women there were 85,584 fewer unemployed and 1,080 more employed. There were 269,139 more women outside the labour force, in a population of women aged 15 and over that was 184,635 larger.

Among men there were 37,788 fewer unemployed and 46,636 more employed. There were 165,629 more men outside the labour force and their population was 174,477 larger. The employment rate fell for both sexes: from 66.7% to 63.5% for men and from 42.6% to 39.0% for women.

Among people aged 15 to 64 the employment rate was 61.3% in 2019 and 61.2% in 2026. That group was 82,544 people larger; within it there were 48,397 more employed, 118,808 fewer unemployed and 152,955 more outside the labour force. So 276,568 of the 359,112 people added to the population aged 15 and over are not aged 15 to 64, and even inside that age range the fall in unemployment came with no rise in the share in work.

Provenance: Source
WHO MOVED, July to September 2019 to July to September 2026. The change in each count for men, for women and for people aged 15 to 64, and the employment rate of each group at both dates. EVERY CHANGE IS A SUBTRACTION MADE HERE on counts taken from the OECD's infra-annual labour statistics, which transcribe the Encuesta Continua de Empleo; the employment rates are those counts divided here, to one decimal. Men and women add up exactly to everyone aged 15 and over. People aged 15 to 64 are a second cut of the same population, not a further group. Read 18 November 2026.
GroupChange in populationChange in employedChange in unemployedChange outside the labour forceEmployment rate, 2019Employment rate, 2026
Everyone aged 15 and over+359,112+47,716-123,372+434,76854.7%51.3%
Men+174,477+46,636-37,788+165,62966.7%63.5%
Women+184,635+1,080-85,584+269,13942.6%39.0%
People aged 15 to 64+82,544+48,397-118,808+152,95561.3%61.2%

Eight years of the same quarter, and a rate that is not at its low

The lowest unemployment rate of any calendar quarter since the survey began is 5.7%, from July to September 2025. A year later it was 6.5%, a rise the office reports as statistically significant. The count of the unemployed went from 134,460 to 154,736 over that year.

The employment rate for the same quarter was 51.7% in 2025 and 51.3% in 2026, a change the office reports as not statistically significant. In none of the seven July to September quarters since 2019 has it returned to the 54.7% of that year.

The comparison does not depend on the choice of quarter. Between the first quarters of 2019 and 2026 there were 112,038 fewer unemployed and 16,726 fewer employed; between the second quarters there were 131,890 fewer unemployed and 279 fewer employed. In all three comparable quarters the employment rate is lower than in 2019.

Provenance: Source
THE SAME QUARTER, EIGHT YEARS, July to September of 2019 to 2026. The unemployed and the employed as counts, and the unemployment rate and the employment rate as the office prints them. THE CHOICE OF THE JULY TO SEPTEMBER QUARTER IS THIS EDITION'S, made so that every row is the same season and the last row is the latest quarter published; the method says what the other quarters show. The counts are the OECD's transcription of the survey and the rates are the Instituto Nacional de Estadística y Censos's.
QuarterUnemployedEmployedUnemployment rateEmployment rate
July to September 2019278,1082,162,61311.4%54.7%
July to September 2020520,2371,846,10922.0%46.1%
July to September 2021378,1302,093,64815.3%51.6%
July to September 2022296,9712,187,88412.0%53.3%
July to September 2023182,6702,077,7428.1%50.0%
July to September 2024159,0452,255,3976.6%53.5%
July to September 2025134,4602,206,5695.7%51.7%
July to September 2026154,7362,210,3296.5%51.3%

What these figures do not say

They do not say that the people who were unemployed in 2019 stopped looking. The survey counts three groups at two dates and follows nobody from one to the other; in seven years people also turned 15, retired, arrived, left and died. A net change in a count is not a movement of persons.

They do not say that the people outside the labour force are unemployed people who gave up. The office classes 97.4% of them as not available for work, 2.2% as available with limitations and 0.4% as available but discouraged, and its extended unemployment rate, which adds the discouraged, is 6.9% against 6.5%.

They do not say that employment rose. The employed are 47,716 more than in 2019 on the July to September comparison, 16,726 fewer on the first quarter and 279 fewer on the second, and the first of those differences sits inside the office's interval for the 2026 count.

They do not say why. The office reports the reasons people outside the labour force gave in 2026 for not being available, but this edition read no such breakdown for 2019, so it compares none and names no cause: not ageing, not care, not study, not migration.

They do not say anything the edition did not read: nothing here is broken out by region, occupation, industry, pay, hours or informality, although the office publishes several of those; no other economy appears; nothing is a forecast; and no figure in this edition comes from our own platform.


What this means for you

If you are hiring in Costa Rica

A lower unemployment rate does not mean that more people are in work, or that fewer could be. From July to September 2026 the survey counted 154,736 unemployed people, 2,210,329 employed and 1,945,426 outside the labour force, and that last group is 434,768 larger than in the same quarter of 2019. The office classes 97.4% of it as not available for work. Nothing here says who is available to hire in any trade or place: this edition read no figure on occupation, industry, pay or region, and every count is a weighted estimate from a sample of households, not a register.

If you are looking for work in Costa Rica

The rate in the headlines counts you only while you are searching. To be unemployed in this survey a person must be without work, available for it and, with three listed exceptions, have taken concrete steps to find work in the last four weeks. Someone who stops searching leaves the count of the unemployed without having found a job. So 6.5% says what share of the labour force was without work and searching in one quarter. It predicts nothing about any individual search, including yours.

How this was counted

Method

  1. THE READ. Two sources, both saved before anything was written. From the Instituto Nacional de Estadística y Censos: the summary of results for July to September 2026, dated 5 November 2026, the general results report for the third quarter of 2026, and the workbook of sampling errors for the same quarter, all fetched on 18 November 2026 at 19:33 UTC. From the OECD: the infra-annual labour statistics dataflow DSD_LFS@DF_IALFS_INDIC for Costa Rica, quarterly and not seasonally adjusted, fetched on 18 November 2026 at 19:28 UTC.
  2. WHY TWO SOURCES. The office's publications for the quarter print counts for 2025 and 2026 only, and rates back to 2016. The counts for 2019, the split by sex in 2019 and the cut for people aged 15 to 64 are taken from the OECD file, which transcribes the same survey. The office's main website returned an access-denied page to this desk, so its documents were read from the public file host its own pages link to, and the sources below are those exact files.
  3. THE TWO SOURCES AGREE WHERE THEY OVERLAP. For July to September 2025 and 2026 the OECD file and the table in the summary give the same counts to the person. And the four rates the report prints for each of the 43 quarters from January to March 2016 to July to September 2026 are reproduced, to the decimal, by dividing the OECD counts: 172 cells out of 172.
  4. THE COUNTS ADD UP EXACTLY. In every quarter the employed, the unemployed and those outside the labour force add up to the population aged 15 and over with no residual, and so do men and women to the total. That is why the three changes in the first table add up to the change in the population to the person.
  5. DERIVED FIGURES, NAMED. Published and printed as published: every count, and the four rates of the population aged 15 and over. Derived here by subtraction: every change in a count, the fall of 44% in the unemployed, the changes of 4.9, 3.4 and 6.9 points between the rates as printed, and the 276,568 people added outside the 15 to 64 age range. The employment rates for men, for women and for people aged 15 to 64 are OECD counts divided here; for 2026 the summary prints 63.5% for men and 39.0% for women, and the division gives the same.
  6. SAMPLING ERROR. The office publishes a 95% confidence interval for each estimate of July to September 2026: 2,132,499 to 2,288,159 for the employed, 131,792 to 177,680 for the unemployed and 49.8% to 52.8% for the employment rate. The 2019 count of the employed lies inside the first interval; the 2019 count of the unemployed and the 2019 employment rate lie outside the other two. That is a comparison with one interval, not a test of the difference: the office tests changes over one year only, and this edition read no interval for 2019.
  7. WHAT WAS TESTED AND REFUSED. That the unemployment rate is at a record low: it was 5.7% a year earlier and the office reports the rise since as significant. That employment rose: the difference is inside the margin of the survey and is negative in two of the three comparable quarters. That the unemployed became discouraged: the office counts 0.4% of the people outside the labour force as discouraged. That the fall in the employment rate is ageing and nothing else: among people aged 15 to 64 the rate did not rise either. And any cause for any figure.
  8. LIMITS. The survey covers residents of private dwellings and excludes collective dwellings; its sample is 9,528 dwellings a quarter and its response rate for the quarter was 88.6%. July to September 2019 is compared with July to September 2026 by the choice of this edition, as the last such quarter before 2020, and the series table prints one quarter a year. The cut for people aged 15 to 64 was read in the OECD file and not in the tables of the office. Nothing is broken out by region, occupation, industry, pay or informality. No comparison is made with any other economy. And no figure in this edition comes from our own platform.
What the data establishes, and what it does not

What the data establishes

  • Between July to September 2019 and July to September 2026 the count of unemployed people in Costa Rica fell from 278,108 to 154,736, which is 123,372 fewer.
  • The unemployment rate fell from 11.4% to 6.5% and the employment rate from 54.7% to 51.3%.
  • The count of the employed is 47,716 higher, the population aged 15 and over 359,112 larger and the count of people outside the labour force 434,768 higher, and the three changes add up exactly.
  • Among women there were 85,584 fewer unemployed and 1,080 more employed; among men there were 37,788 fewer unemployed and 46,636 more employed.
  • Among people aged 15 to 64 the employment rate was 61.3% in 2019 and 61.2% in 2026.
  • The lowest unemployment rate of any calendar quarter since the survey began in 2010 is 5.7%, from July to September 2025, and a year later it was 6.5%.

What it does not

  • That the 123,372 people no longer counted as unemployed found work or gave up looking: the survey follows no person from one count to another.
  • That employment rose: the 47,716 is inside the survey's margin, and the first and second quarters show 16,726 and 279 fewer employed than in 2019.
  • That the unemployment rate is at a record low: it was 5.7% a year earlier, against 6.5% now.
  • That people outside the labour force are hidden unemployed: the office classes 97.4% of them as not available for work and 0.4% as discouraged.
  • That ageing, care, study, migration or anything else is the cause: no figure read here compares reasons between 2019 and 2026.
  • Anything about region, occupation, industry, pay, hours or informality, about any other economy, or about any quarter to come.
Primary sources

BabZituna scores every job against your profile on six real dimensions, and publishes what it can and cannot measure. See the live market.

Earlier editions