Skip to content
Sign inGet started free
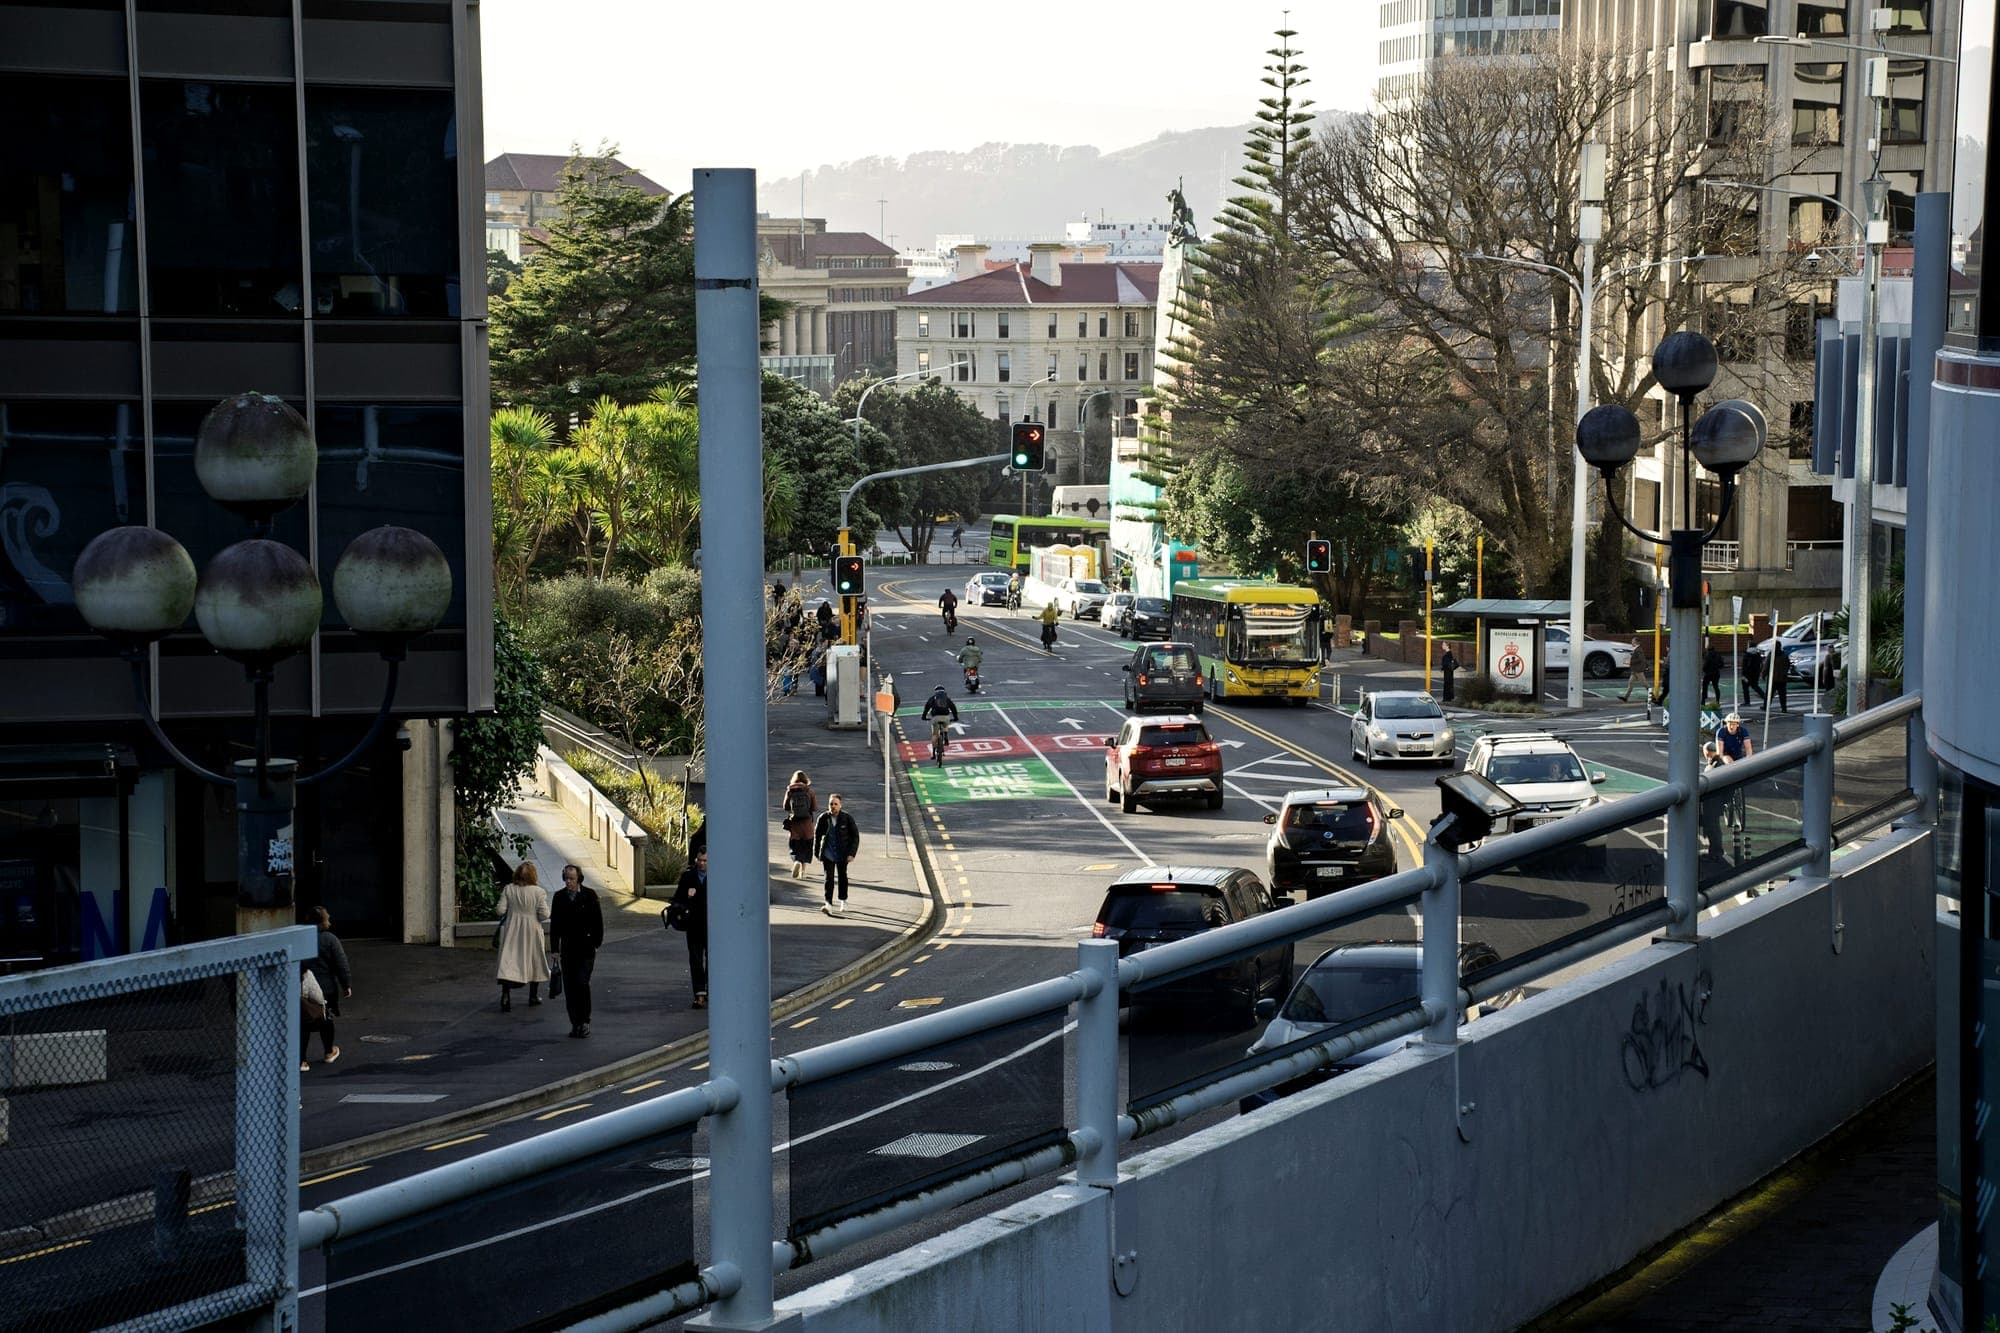
Photo: Matthew Larsen / Unsplash · New Zealand

Market watch · 66

New Zealand has more under-25s but fewer in work

More of the difference sits outside the labour force than in unemployment, and the file does not say what those young people are doing.

A country can have more young people and fewer of them in work at the same time. In New Zealand the population aged 15 to 24 is 50,500 larger than four years ago and the count of them in employment is 40,000 smaller. Here is what the figures count, where the difference sits, how the older age groups compare, and what eight years of the same quarter show.

61.4%of people aged 15 to 24 in New Zealand employed, July to September 2022
51.1%employed in the same quarter of 2026
40,000fewer employed people aged 15 to 24 than four years earlier, in a population 50,500 larger

The employment rate of under-25s is 10.3 points below its level of 2022

201955.5%
202052.1%
202157.6%
202261.4%
202359.0%
202455.3%
202552.6%
202651.1%
New Zealand, people aged 15 to 24, July to September of each year from 2019 to 2026. EACH BAR IS THE EMPLOYED AS A PERCENTAGE OF EVERYONE IN THE AGE GROUP, not of its labour force, and starts at zero. The counts are published in the OECD's infra-annual labour statistics, not seasonally adjusted; each rate is those counts divided here, to one decimal. Read 19 November 2026.

Half of under-25s are employed, against six in ten in 2022

From July to September 2026, 353,000 of the 690,200 people aged 15 to 24 in New Zealand were employed, which is 51.1%. In the same quarter of 2022 it was 393,000 of 639,700, which is 61.4%.

That percentage is the employment rate, and it divides by everyone in the age group. The unemployment rate divides by the labour force only, so neither rate can be worked out from the other.

The figures are not seasonally adjusted, so every comparison here sets a quarter against the same quarter of another year. They come from one file, the infra-annual labour statistics the OECD publishes for New Zealand.

Provenance: SourceWhat the figures count
  1. THREE GROUPS MAKE UP THE AGE GROUP. The working-age population is the labour force plus the inactive population, and the labour force is the employed plus the unemployed. So every person aged 15 to 24 is employed, unemployed or outside the labour force.
  2. THE EMPLOYMENT RATE DIVIDES BY THE WHOLE AGE GROUP. It is the employed population divided by the working-age population, which here is everyone aged 15 to 24.
  3. THE UNEMPLOYMENT RATE DIVIDES BY THE LABOUR FORCE. It is the unemployed population divided by the labour force. People outside the labour force are in neither part of that fraction.
  4. OUTSIDE THE LABOUR FORCE IS A COUNT, NOT A REASON. The file counts the people in that group and gives no breakdown of what they do, study included.

So these figures say how many people aged 15 to 24 were placed in each of three groups in one quarter of 2022 and in the same quarter of 2026, and nothing about which person is in which group, or why.

The OECD publishes a short set of relationships with this dataset, and the piece rests on them. They are restated here; the questionnaire definitions of the survey behind the file were not read.

40,000 fewer employed in a population 50,500 larger

The count of employed people aged 15 to 24 went from 393,000 to 353,000, which is 40,000 fewer. The population of that age went from 639,700 to 690,200, which is 50,500 more.

The count of unemployed people of that age went from 37,100 to 71,700, which is 34,600 more, and the count outside the labour force went from 209,700 to 265,500, which is 55,800 more. So the larger of the two increases is among people who are neither employed nor counted as unemployed.

The unemployment rate of the age group went from 8.6% to 16.9%. That is a share of the 424,700 people aged 15 to 24 in the labour force. As a share of all 690,200 people of that age, the unemployed are 10.4% and the people outside the labour force are 38.5%.

Provenance: Source
THE SAME QUARTER, FOUR YEARS APART. People aged 15 to 24 in New Zealand by labour force status, July to September 2022 and July to September 2026, and the change. THE TWO COLUMNS OF COUNTS ARE PUBLISHED, ROUNDED TO THE HUNDRED; THE CHANGE IS A SUBTRACTION MADE HERE. Because each count is rounded separately, the three changes below the first row add up to 50,400, which is 100 short of the change in the population. OECD, infra-annual labour statistics, not seasonally adjusted, read 19 November 2026.
Labour force statusJuly to September 2022July to September 2026Change (derived here)
Population aged 15 to 24639,700690,200+50,500
Employed393,000353,000-40,000
Unemployed37,10071,700+34,600
Outside the labour force209,700265,500+55,800

The older age groups moved far less

Among people aged 25 to 54 the employment rate went from 85.9% to 84.0%, which is 1.9 points lower, against 10.3 points lower for people aged 15 to 24. That older group has 54,800 more employed in a population 110,900 larger.

Among people aged 55 to 64 the employment rate went from 78.7% to 78.1%, which is 0.6 points lower. That group has 4,000 more employed in a population 9,900 larger.

Across everyone aged 15 and over the employed are 60,300 more than in 2022, and the employment rate went from 69.2% to 66.2%. Of the three age groups read here, people aged 15 to 24 are the only one with a smaller count in employment.

Provenance: Source
THREE AGE GROUPS, THE SAME TWO QUARTERS. The employment rate of each age group from July to September 2022 and July to September 2026, the change in points, and the change in the count of the employed and in the population. THE EMPLOYMENT RATE DIVIDES BY EVERYONE IN THE AGE GROUP. Each rate is published counts divided here, to one decimal; the change in points is a subtraction of the two rates as printed; the changes in counts are subtractions made here. OECD, infra-annual labour statistics, not seasonally adjusted, read 19 November 2026.
Age groupEmployment rate, 2022Employment rate, 2026Change in points (derived here)Change in employedChange in population
Aged 15 to 2461.4%51.1%-10.3-40,000+50,500
Aged 25 to 5485.9%84.0%-1.9+54,800+110,900
Aged 55 to 6478.7%78.1%-0.6+4,000+9,900

Eight years of the same quarter, and 2022 was the high point

The 61.4% of July to September 2022 is the highest of the eight July to September quarters from 2019 to 2026. Each one since has been lower than the one before: 59.0%, then 55.3%, then 52.6%, then 51.1%.

Measured from 2019 instead of 2022, the employment rate went from 55.5% to 51.1%. On that comparison there are 9,700 fewer employed people aged 15 to 24 in a population 36,900 larger.

The size of the difference depends on the quarter chosen, and its direction does not. Between the first quarters of 2022 and 2026 there are 19,400 fewer employed people of that age, and between the second quarters 16,300 fewer; the employment rate went from 61.0% to 54.0% on the first and from 58.6% to 52.1% on the second.

The latest rate is not the lowest in the file. Of its 47 quarters, one has a lower employment rate for this age group: July to September 2015, at 50.8%.

Provenance: Source
THE SAME QUARTER, EIGHT YEARS, people aged 15 to 24, July to September of 2019 to 2026. The population, the employed and the unemployed as published counts, the employment rate as a share of the population and the unemployment rate as a share of the labour force. THE CHOICE OF THE JULY TO SEPTEMBER QUARTER IS THIS EDITION'S, made so that every row is the same season and the last row is the latest quarter in the file; the text says what the other quarters show. OECD, infra-annual labour statistics, not seasonally adjusted; the rates are divided here.
QuarterPopulationEmployedUnemployedEmployment rateUnemployment rate
July to September 2019653,300362,70042,80055.5%10.6%
July to September 2020653,800340,80051,90052.1%13.2%
July to September 2021642,200369,60039,30057.6%9.6%
July to September 2022639,700393,00037,10061.4%8.6%
July to September 2023660,300389,50049,00059.0%11.2%
July to September 2024674,300372,80056,30055.3%13.1%
July to September 2025680,800358,30064,20052.6%15.2%
July to September 2026690,200353,00071,70051.1%16.9%

What these figures do not say

They do not say that 40,000 young people lost a job. The file counts an age group at two dates and follows nobody: anyone who was 21 or older in 2022 had left the group by 2026, and others turned 15, arrived or left the country. A difference between two counts is not a movement of persons.

They do not say that the 265,500 young people outside the labour force are idle. The file gives no breakdown of that group, so this edition does not say how many of them are studying, and it does not call any of them unemployed.

They do not say that the unemployment rate of people aged 15 to 24 has never been higher. It was 17.3% in each of the first two quarters of 2026, against 16.9% in the latest.

They do not say why. This edition read no figure that compares reasons, so it names no cause: not study, not migration, not wages, not the state of the economy.

They do not say anything the edition did not read: no margin of error is in the file, nothing here is broken out by region, sex, ethnicity, occupation, industry or pay, no other economy appears, nothing is a forecast, and no figure in this edition comes from our own platform.

What this means for you

If you are hiring in New Zealand

From July to September 2026 the file counts 71,700 unemployed people aged 15 to 24, against 37,100 in the same quarter of 2022, and 265,500 outside the labour force. The first group is in the labour force without a job; the second is not in the labour force, and the file does not say what its members are doing. Nothing here says who is available to hire in any trade or place: this edition read no figure on occupation, industry, pay or region, and every count is a survey estimate rounded to the hundred, not a register.

If you are under 25 and looking for work in New Zealand

The 16.9% in this edition is the share of the labour force aged 15 to 24 that was unemployed in one quarter. It is a share of 424,700 people, not of all 690,200 people of that age, and 353,000 of them were employed in the same quarter. A rate describes a group at a date. It predicts nothing about any individual search, including yours.

How this was counted

Method

  1. THE READ. One source, saved before anything was written: the OECD dataflow DSD_LFS@DF_IALFS_INDIC, "Infra-annual labour statistics", for New Zealand, fetched on 19 November 2026 at 19:04 UTC. The edition uses its quarterly series that are not seasonally adjusted, for the 47 quarters from January to March 2015 to July to September 2026.
  2. WHAT THE FILE DOES NOT CARRY. It names neither the national statistics office nor its survey, it prints no margin of error, and it gives no definition beyond the relationships restated above. So this edition names no office, quotes no margin and treats no single difference as measured to the person.
  3. THE COUNTS ARE ROUNDED TO THE HUNDRED. Every count for people aged 15 to 24 in the 47 quarters is a multiple of 100, and each is rounded separately. The employed plus the unemployed equal the published labour force exactly in 25 quarters, and the labour force plus the people outside it equal the published population exactly in 29; the largest miss in either is 200 persons. That is why the three changes in the first table add up to 50,400 and not to 50,500.
  4. THE RATES ARE REPRODUCED. The OECD publishes an employment rate, an unemployment rate and a participation rate for the age group in each quarter. Dividing its published counts reproduces all 141 of those cells. The rates printed here are those divisions, rounded once, to one decimal.
  5. DERIVED FIGURES, NAMED. Published and printed as published: every count. Derived here: every change in a count, every rate to one decimal, the changes of 10.3, 1.9 and 0.6 points, which are subtractions of the rates as printed, and the 10.4% and 38.5% of the whole age group.
  6. SEASONS. The series used are not seasonally adjusted, so only like quarters are compared. As a cross-check, the OECD's own seasonally adjusted employment rate for people aged 15 to 24 is 62.6% for July to September 2022 and 52.2% for July to September 2026.
  7. WHAT WAS TESTED AND REFUSED. That the difference is 40,000 whatever the quarter: it is 19,400 on the first quarter and 16,300 on the second. That the employment rate is at a record low: it was 50.8% from July to September 2015. That the unemployment rate of the age group has never been higher: it was 17.3% in each of the first two quarters of 2026. That the young people outside the labour force are idle or are students: the file does not say. And any cause for any figure.
  8. LIMITS. The age groups are the ones the file cuts: 15 to 24, 25 to 54 and 55 to 64, with everyone aged 15 and over as the total. An age group is not a cohort. July to September 2022 is compared with July to September 2026 by the choice of this edition, as the highest such quarter of the eight printed, and the text gives the comparison from 2019 and on the other two quarters. Nothing is broken out by region, sex, ethnicity, occupation, industry or pay. No comparison is made with any other economy. And no figure in this edition comes from our own platform.
What the data establishes, and what it does not

What the data establishes

  • From July to September 2026, 353,000 of the 690,200 people aged 15 to 24 in New Zealand were employed, against 393,000 of 639,700 in the same quarter of 2022.
  • The employment rate of that age group went from 61.4% to 51.1%.
  • There are 34,600 more unemployed people aged 15 to 24 and 55,800 more outside the labour force than four years earlier.
  • The employment rate went from 85.9% to 84.0% among people aged 25 to 54 and from 78.7% to 78.1% among people aged 55 to 64.
  • On the first and second quarters of the same two years there are 19,400 and 16,300 fewer employed people aged 15 to 24.

What it does not

  • That 40,000 young people lost a job: the file follows no person, and anyone aged 21 or over in 2022 had left the age group by 2026.
  • That the 265,500 young people outside the labour force are idle: the file gives no breakdown of what they do, study included.
  • That the employment rate of people aged 15 to 24 is at a record low: it was 50.8% from July to September 2015, against 51.1% now.
  • That their unemployment rate has never been higher: it was 17.3% in each of the first two quarters of 2026, against 16.9% now.
  • Anything about a cause, about region, sex, ethnicity, occupation, industry or pay, about any other economy, or about any quarter to come.
Primary sources

BabZituna scores every job against your profile on six real dimensions, and publishes what it can and cannot measure. See the live market.

Earlier editions