Skip to content
Sign inGet started free
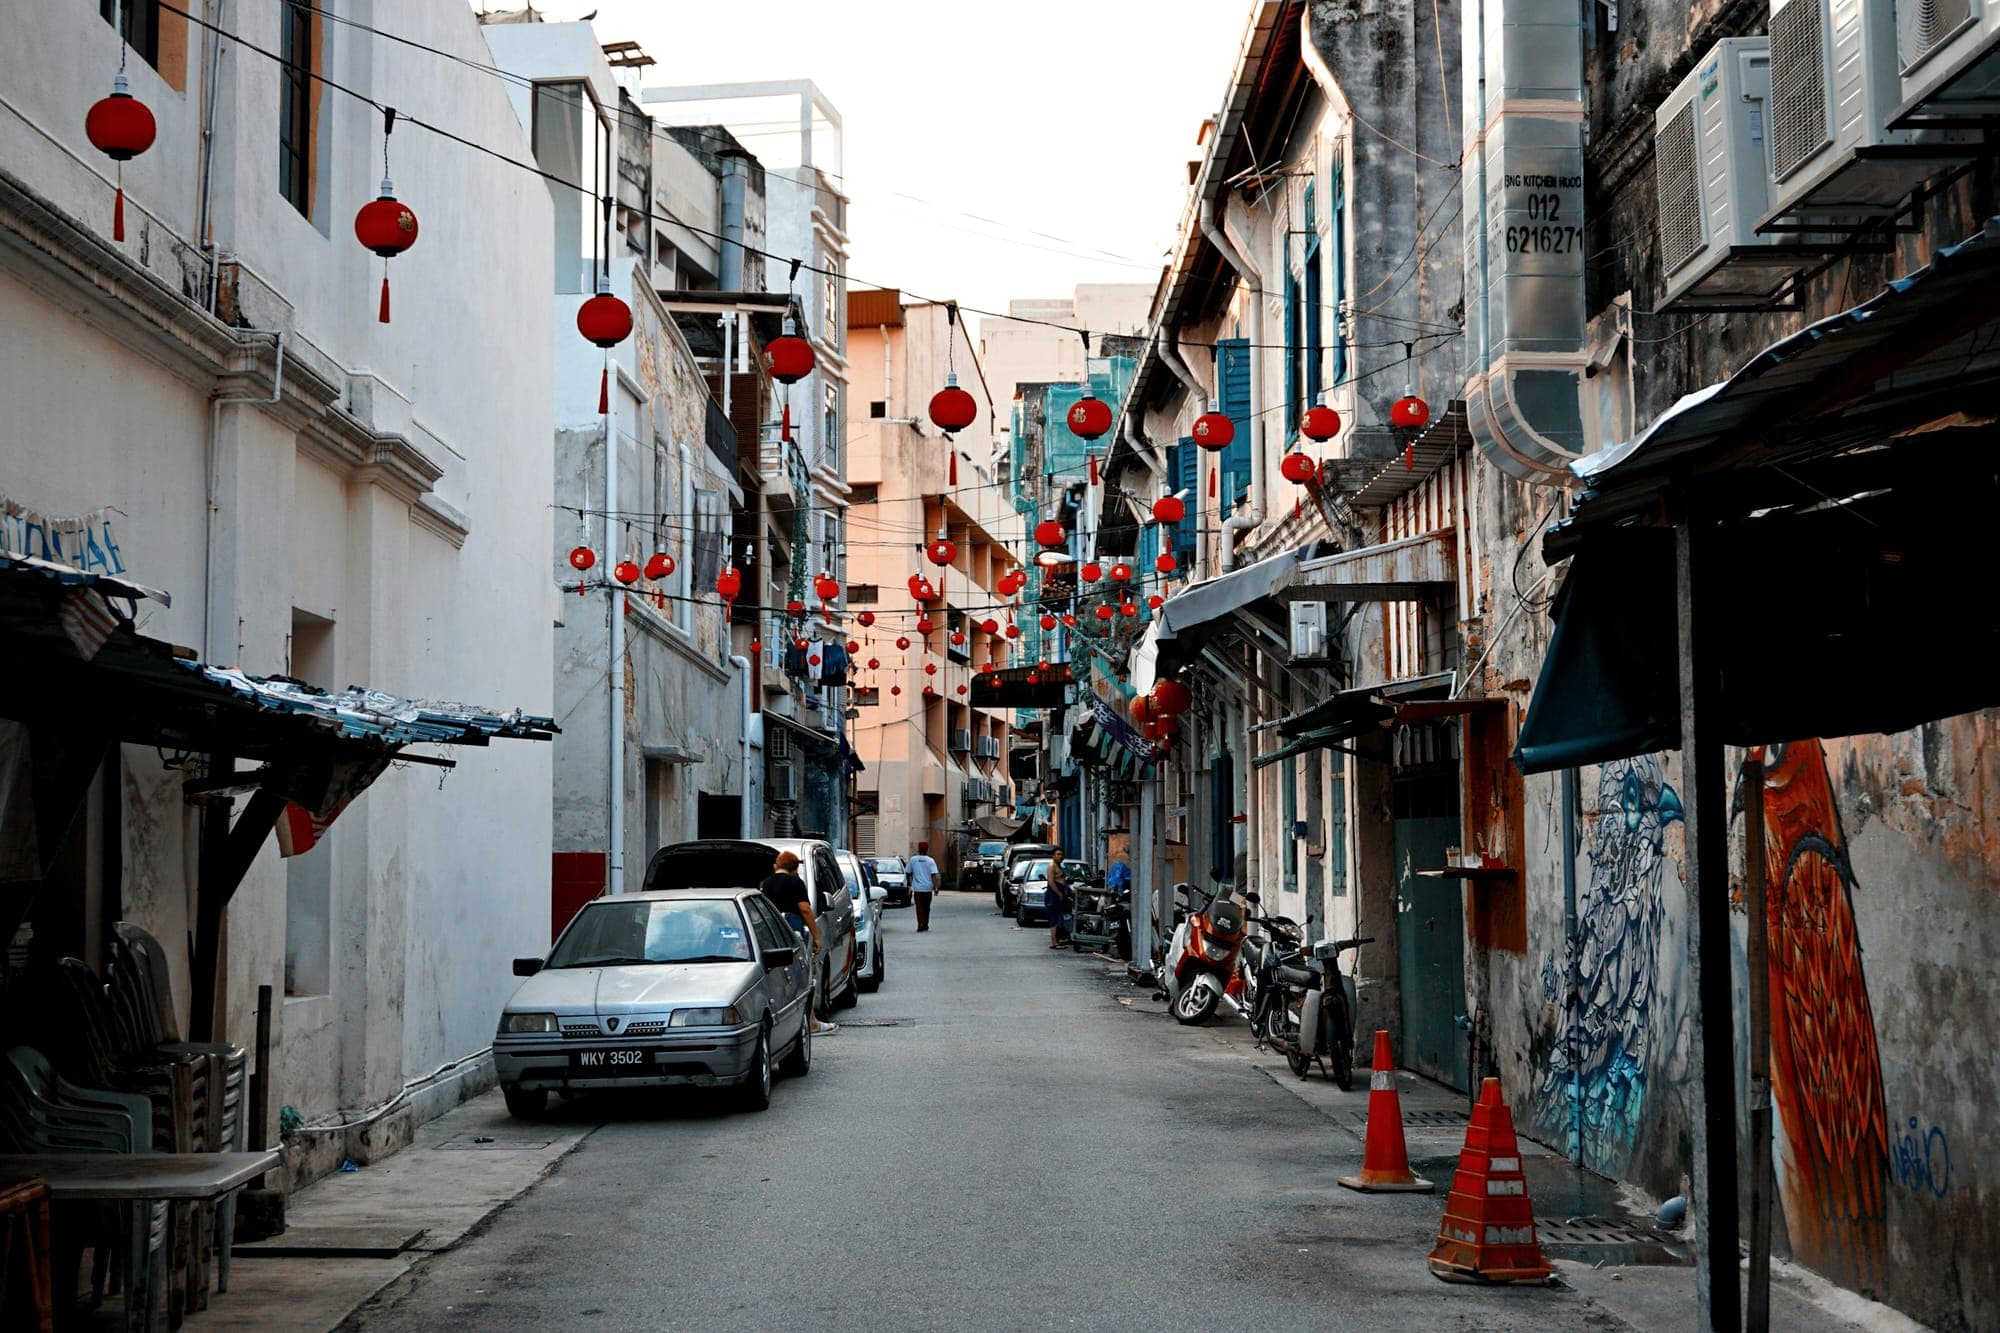
Photo: Marcus Loke / Unsplash · Malaysia

Market watch · 63

20.6% of Malaysia's unemployed are not actively looking for work

The office counts both groups as unemployed and says so in its definition, so the split does not change the rate: it changes what the rate can be taken to mean about who is searching.

The Department of Statistics Malaysia splits its unemployed into two groups and publishes both every month. One was looking for work in the survey week. The other was not, for one of three reasons the office names: believing no work was available, a temporary illness or the weather, or waiting for the result of applications already made. Here is what each group is, how large it was in June 2026, what the split does to the reading of a 3.0% rate, and why the figures on how long people have been looking cover only the first group.

3.0%the published unemployment rate in June 2026, on all 517,800 unemployed
2.4%the actively unemployed alone, on the same labour force of 17,344,900 (derived)
20.6%of the unemployed, 106,900 people, were not actively looking for work

20.6% of the unemployed were not looking, and 50.5% had looked for under three months

Under 3 months50.5%
3 to 6 months16.3%
6 to 12 months8.3%
Over 12 months4.2%
Not looking20.6%
The 517,800 people Malaysia counted as unemployed in June 2026, divided the way the Department of Statistics Malaysia publishes them: four bands by how long the actively unemployed have been looking, and the inactively unemployed as a fifth bar. Each bar is a percent of all 517,800. NO DURATION IS PUBLISHED FOR THE INACTIVELY UNEMPLOYED, so the fifth bar is one group and not a length of time. The five bars come to 99.9% because every count is rounded to the nearest hundred people independently. The percentages are this edition's division of two published counts, rounded once. Department of Statistics Malaysia, Labour Force Survey, read 15 November 2026.

One count of the unemployed, split by who was looking

In June 2026 Malaysia counted 517,800 people as unemployed, and its statistics office publishes that count in two groups. 410,900 were actively unemployed and 106,900 were inactively unemployed. The two add to the total exactly in this month.

The difference between the groups is whether the person looked for work in the survey week. The actively unemployed were available for work and actively looking for it. The inactively unemployed were not looking that week, for one of three reasons the office names.

Both groups are unemployed by definition, and that is the fact every other figure here depends on. The office does not treat the second group as outside the labour force, and neither does this edition.

Provenance: SourceWhat the survey counts
  1. THE UNEMPLOYED ARE DEFINED AS TWO GROUPS. Section 6.2 of the Labour Force Survey Technical Notes says the unemployed are those who did not work during the reference week and are classified into two groups, the actively unemployed and the inactively unemployed. Both are unemployed. Both are therefore in the labour force, which the same section defines as the population aged 15 to 64 who are either employed or unemployed.
  2. THE ACTIVELY UNEMPLOYED WERE AVAILABLE AND LOOKING. The notes define them as all persons who were available for work and were actively looking for work during the reference week. In June 2026 that was 410,900 people.
  3. THE INACTIVELY UNEMPLOYED ARE THREE NAMED CATEGORIES. People who did not look for work because they believed no work was available or that they were not qualified. People who would have looked for work if they had not been temporarily ill or had it not been for the weather. And people who had looked for work before the reference week and were waiting for the result of job applications. In June 2026 the three together were 106,900 people. THE OFFICE DOES NOT PUBLISH THE THREE SEPARATELY in the table read here, so this edition cannot say how many are waiting on an application and how many have stopped looking.
  4. INACTIVELY UNEMPLOYED IS NOT OUTSIDE THE LABOUR FORCE. The notes define a separate category, outside the labour force, for everyone classified neither as employed nor as unemployed, and list in it housewives, students, the retired, disabled persons and those not interested in looking for a job. That category held 7,104,000 people in September 2026. The 106,900 are not among them.
  5. THE RATE COUNTS BOTH GROUPS. Section 6.8 defines the unemployment rate as the number of unemployed persons divided by the number of persons in the labour force, times 100. 517,800 over 17,344,900 is 3.0%, the published figure. No rate of the actively unemployed alone is published.
  6. DURATION EXISTS FOR ONE GROUP ONLY. The catalogue describes the four duration fields as the number of people who have been actively unemployed for each length of time. No duration field exists for the inactively unemployed.

So this table says how many people Malaysia counted as unemployed in June 2026, how many of them were looking that week and how many were not, and how long the first group had looked so far, and nothing about why any one of them is without work, which of the three reasons the second group gave, or what becomes of either.

One count of unemployed people, split by whether each of them looked for work in the survey week. A reading that moves the second group outside the labour force, or that calls the first group the real unemployed, says what this office does not.

106,900 of the 517,800 were not looking that week

106,900 of the 517,800 unemployed, which is 20.6%, were inactively unemployed in June 2026. The other 410,900, or 79.4%, were actively unemployed. Roughly one unemployed person in five was not looking for work in the week the survey asked about.

The three reasons are not the same kind of reason, and the table does not separate them. Someone waiting for the result of an application has searched and may be days from a job. Someone who believes no work is available has stopped searching. Someone temporarily ill would be searching otherwise. The office counts all three in one figure.

So the 106,900 cannot be given a single name. They are not all discouraged, not all waiting, and not all ill, and this edition read no figure that divides them.

Provenance: Source
The unemployed of Malaysia in June 2026, aged 15 to 64, in the two groups the Department of Statistics Malaysia publishes: the count of each and that count as a percent of all the unemployed. "Actively unemployed" and "inactively unemployed" are the office's own terms for two groups INSIDE one count of unemployed people. The two published counts add to 517,800 exactly in this month. The percentages are this edition's division of two published counts, rounded once. Department of Statistics Malaysia, Labour Force Survey, table lfs_month_duration, read 15 November 2026.
GroupPeoplePercent of the unemployedLooked for work in the survey week
Actively unemployed410,90079.4%Yes
Inactively unemployed106,90020.6%No
All unemployed517,800100.0%

The 3.0% rate includes both groups

The published unemployment rate for June 2026 is 3.0%: 517,800 unemployed over a labour force of 17,344,900. That is the rate as the office defines it, and it contains everyone in both groups.

Divide each group by the same labour force and the 3.0% separates into 2.4% and 0.6%. The actively unemployed are 2.4% of the labour force and the inactively unemployed 0.6%. Both figures are this edition's arithmetic on published counts; the office publishes neither.

Neither figure replaces the published one. 2.4% is the share of the labour force that was without work and searching in the survey week. It is not a truer unemployment rate, because the office's definition of unemployment does not require a search in that week, and the definition is the office's to set.

Provenance: Source
ONE LABOUR FORCE, THREE DIVISIONS, June 2026. The first row is the published unemployment rate, which the technical notes define as the unemployed divided by the labour force: 517,800 over 17,344,900. The second and third rows divide each of the two groups by that same labour force and are DERIVED by this edition; the office publishes neither. They add to the published rate because the two groups add to the unemployed. Neither derived row is an unemployment rate under any definition read here, and 2.4% is not a corrected version of 3.0%: the office counts both groups as unemployed. Department of Statistics Malaysia, Labour Force Survey, tables lfs_month and lfs_month_duration.
MeasurePeoplePercent of the labour forceStatus of the figure
All unemployed (the unemployment rate)517,8003.0%Published
Actively unemployed only410,9002.4%Derived here
Inactively unemployed only106,9000.6%Derived here

How long people had been looking, for those who were

Of the actively unemployed, 261,500 had been looking for less than three months. That is 50.5% of all the unemployed. A further 84,600 had looked for three to six months and 42,900 for six to twelve.

21,800 people had been looking for more than a year, and the denominator decides what share that is. They are 4.2% of all 517,800 unemployed and 5.3% of the 410,900 actively unemployed. Both are correct and they are not interchangeable.

No duration is published for the inactively unemployed. Nothing read here says how long any of the 106,900 has been without work, so a statement about long-term unemployment in Malaysia drawn from this table is a statement about the actively unemployed and no one else.

Provenance: Source
HOW LONG THE ACTIVELY UNEMPLOYED HAD BEEN LOOKING, June 2026, and the group for which no duration exists. The four bands are published for the actively unemployed only and add to 410,800 against a published 410,900, a difference of 100 people that is rounding. Every percentage is of ALL 517,800 unemployed, one denominator for the whole table, and is this edition's division. The durations are of searches still in progress in the survey week, not of completed ones. Department of Statistics Malaysia, Labour Force Survey, table lfs_month_duration.
Time spent looking so farPeoplePercent of all unemployed
Less than 3 months261,50050.5%
3 to 6 months84,60016.3%
6 to 12 months42,9008.3%
More than 12 months21,8004.2%
Inactively unemployed (no duration published)106,90020.6%
All unemployed517,800100.0%

Eighteen months, and the share stays near one in five

In every one of the eighteen months from January 2025 to June 2026 the inactively unemployed were between 20.1% and 20.6% of the unemployed. The lowest reading is June 2025 and the highest is June 2026. The office publishes no margin of error with this table, so this edition does not call that movement a rise.

The window starts in January 2025 because the publisher draws a line there. Its caveat says data from 2025 onwards is compiled on the 2020 Census and earlier data on the 2010 Census, and that a trend break may be observed. Nothing in this edition is compared across that line.

The table reaches back to January 2016 and holds one movement this edition reports and does not explain. Between December 2018 and January 2019 the inactively unemployed go from 184,400 to 114,900 and the actively unemployed from 329,700 to 400,800, in one month, while the total goes from 514,200 to 515,600. No note read here accounts for it.

Provenance: Source
The eighteen months from January 2025 to June 2026: the unemployed, the two groups, and the inactively unemployed as a percent of the unemployed. IT STARTS AT JANUARY 2025 BECAUSE THE PUBLISHER SAYS SO: data from 2025 onwards is compiled on the 2020 Census and earlier data on the 2010 Census, and the catalogue warns of a trend break between them. Inside these eighteen months the share stays between 20.1% and 20.6%. The office publishes no margin of error with this table, so the movement from 20.1% to 20.6% is not called a rise. The table goes back to January 2016, and between December 2018 and January 2019 the inactively unemployed go from 184,400 to 114,900 in a single month while the total goes from 514,200 to 515,600; nothing read here explains that, so no figure is compared across it. The counts are published; the share is derived. Department of Statistics Malaysia, Labour Force Survey.
MonthUnemployedActively unemployedInactively unemployedInactive share of the unemployed
January 2025532,200423,500108,70020.4%
February 2025530,200421,700108,50020.5%
March 2025528,000420,100107,90020.4%
April 2025525,400418,700106,70020.3%
May 2025524,000417,900106,00020.2%
June 2025518,700414,400104,30020.1%
July 2025521,600416,200105,50020.2%
August 2025520,000414,900105,10020.2%
September 2025518,600413,600104,90020.2%
October 2025518,900413,800105,10020.3%
November 2025518,400413,500104,90020.2%
December 2025508,000405,500102,40020.2%
January 2026509,600406,900102,80020.2%
February 2026506,800404,700102,10020.1%
March 2026509,000405,800103,20020.3%
April 2026511,800407,100104,70020.5%
May 2026513,400408,000105,50020.5%
June 2026517,800410,900106,90020.6%

What these figures do not say

They do not say that Malaysia's real unemployment rate is 2.4%. The office defines the unemployed as two groups and counts both, and 3.0% is the rate under that definition. The 2.4% is the actively unemployed over the labour force, a derived share with its own meaning, and this edition prints it beside the published rate and never in place of it.

They do not say that the 106,900 are discouraged workers. Believing no work is available is one of three reasons the office lists; the other two are temporary illness or weather, and waiting for the result of applications. The table read here does not divide the three, so no share of the group can be called discouraged, and none is.

They do not say that the inactively unemployed are outside the labour force, hidden, or uncounted. They are counted, inside the unemployed, inside the labour force and inside the published rate. The category outside the labour force is a different one with its own definition.

They do not say that one unemployed person in five has given up, that the share is rising, or that it is at a high. The eighteen comparable months run from 20.1% to 20.6% with no published margin of error, and the earlier years are compiled on a different census.

They do not say how long a search lasts. The durations are of searches still under way in the survey week. And they do not say anything the edition did not read: nothing here is broken out by sex, age, state, education or occupation; no other country appears and no comparison with any other country's definition is made; no cause is named for any figure; nothing is a forecast; and no figure in this edition comes from our own platform.
What this means for you

If you are hiring in Malaysia

The 517,800 people counted as unemployed in June 2026 are not 517,800 people answering advertisements. 410,900 of them were actively looking in the survey week, and 261,500 of those had been looking for less than three months. The other 106,900 were not looking that week, and the office names three reasons without publishing how many people gave each: believing there was no work, being temporarily ill, or waiting to hear back about applications already sent. So some of that group has already applied somewhere and some has stopped applying, and the table cannot tell you which. Nothing here says what any of these people can do: this edition read no figure on occupation, education or skill, and the counts are weighted estimates from a household survey, not a register.

If you are looking for work in Malaysia

If you are waiting to hear back and did not send a new application in the survey week, Malaysia still counts you as unemployed: you are in the 106,900, not outside the labour force. If you are searching now, you are in the 410,900, and 261,500 of that group had been looking for under three months while 21,800 had been looking for more than a year. Those durations describe searches still in progress on the day of the survey, so they say how long people had looked so far and never how long a search takes to end. None of these figures predicts anything about any individual search, including yours.

How this was counted

Method

  1. THE READ. Two tables from the Department of Statistics Malaysia's keyless open-data API, requested as JSON on 15 November 2026 at 19:28 UTC. lfs_month_duration, "Breakdown of monthly unemployed figures by duration of unemployment", data as of June 2026: 126 monthly rows from January 2016. lfs_month, the headline monthly series, data as of September 2026: 201 monthly rows from January 2010. The catalogue stamps both as last updated 2026-11-11 12:30 and prints no time zone, so none is given here. Both responses were saved before anything was written.
  2. THE DEFINITIONS WERE READ, NOT PARAPHRASED. The Labour Force Survey Technical Notes, the file the catalogue links for the full methodology, was read in sections 4.4, 6.1, 6.2 and 6.8. The file is the technical-notes chapter of the Labour Force Survey Report for the third quarter of 2023 and was last modified on 28 January 2024, which is the version read. The three categories of the inactively unemployed are given in the office's own wording, and the catalogue's field description for the same column was read alongside it and agrees.
  3. THE SPLIT ADDS UP, AND THE RESIDUALS ARE ROUNDING. In June 2026 the two groups add to the unemployed exactly. Over the eighteen printed months the two groups land at most 100 people from the published total, and the four duration bands at most 100 people from the published actively unemployed, in both directions, because every cell is rounded to the nearest hundred people independently. The catalogue's own caveat says the same of its sums.
  4. TWO TABLES, AND WHERE THEY PART. The unemployed column of the duration table and the unemployed column of the headline table are published separately. They are identical in fourteen of the eighteen printed months, June 2026 among them. In the four months from June to September 2025 the headline table carries a figure between 500 and 3,000 people away from the duration table, in both directions, and nothing read here explains it. So every share in this edition is computed inside the duration table alone, and the labour force is taken from the headline table for June 2026 only, a month in which the two tables agree.
  5. THE PUBLISHED RATE RECOMPUTED. The unemployed divided by the labour force reproduces the published unemployment rate to one decimal in all eighteen printed months, 3.0% for June 2026 among them, which is what fixes the denominator of the derived rows.
  6. DERIVED FIGURES, NAMED. Published and printed as published: every count in thousands of people and the unemployment rate. Derived here, by dividing two published counts and rounding once: the 20.6% and 79.4% shares of the unemployed, the 2.4% and 0.6% of the labour force, the four band shares of all unemployed, 50.5%, 16.3%, 8.3% and 4.2%, the 5.3% of the actively unemployed, and every share in the series table.
  7. WHAT WAS TESTED AND REFUSED. That the share is rising: 20.1% to 20.6% over eighteen months with no published margin of error. That it is at a high: the months before 2025 are on a different census and carry readings from 15.4% to 49.8%, none of them comparable. That 2.4% is the real rate: the definition counts both groups. That the 106,900 are discouraged workers: discouragement is one of three reasons and the three are not published separately. And any cause for any figure.
  8. LIMITS. Nothing here names a cause, follows a person, or reaches across January 2025 or across the movement between December 2018 and January 2019. June 2026 is the latest month the duration table holds; the headline table runs to September 2026, when 513,200 people were unemployed and the rate was 2.9%, and no split of that month exists yet. No figure is broken out by sex, age, state, education or occupation. No comparison is made with any other country. The counts are weighted estimates from a household survey of people aged 15 to 64 in private living quarters, not a register of jobseekers. And no figure in this edition comes from our own platform.
What the data establishes, and what it does not

What the data establishes

  • In June 2026 Malaysia counted 517,800 people as unemployed: 410,900 actively unemployed and 106,900 inactively unemployed, the second group being 20.6% of the total.
  • The published unemployment rate of 3.0% is all 517,800 over a labour force of 17,344,900; on that labour force the actively unemployed are 2.4% and the inactively unemployed 0.6%, both derived.
  • Both groups are unemployed and in the labour force under the definition in the office's technical notes.
  • Of the actively unemployed, 261,500 had been looking for less than three months and 21,800 for more than a year; no duration is published for the inactively unemployed.
  • In all eighteen months from January 2025 to June 2026 the inactively unemployed were between 20.1% and 20.6% of the unemployed.

What it does not

  • That the real unemployment rate is 2.4%: the office defines the unemployed as both groups, and 3.0% is the rate under that definition.
  • That the 106,900 are discouraged workers: discouragement is one of three reasons the office lists, and the three are not published separately.
  • That the inactively unemployed are outside the labour force or uncounted: they are inside the unemployed and inside the published rate.
  • That the share is rising or at a high: the eighteen comparable months run from 20.1% to 20.6% with no published margin of error.
  • Anything about the years before 2025 as levels, or about why the two groups move as they do between December 2018 and January 2019: the earlier data is on a different census and no note read explains the movement.
  • Anything about how long the inactively unemployed have been without work, and nothing about sex, age, state, education, occupation, any other country, or any month to come.
Primary sources

BabZituna scores every job against your profile on six real dimensions, and publishes what it can and cannot measure. See the live market.

Earlier editions